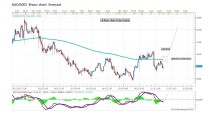
The AUDCAD has started to rally after breaking down below its support area which is visible in light blue in the above H4 chart. The Bollinger Band Indicator has now encircled its support area which suggests that price action may trend sideways and struggle over the next few trading sessions. This currency pair is trading around the middle band of its Bollinger Band Indicator which further points towards a potentially stagnant trading session until a catalyst will emerge.
A sideways trend can expose the AUDCAD to a breakdown as well as a breakout, but the path of least resistance is to the upside. Once the AUDCAD settles between its middle band and its upper band of its Bollinger Band indicator forex traders are likely to realize floating trading profits which will rally this currency pair back into its resistance area, visible in light grey in the above chart. A breakout above its support area as well as upper band of tis Bollinger Band is expected to lead to an increase in buy orders.
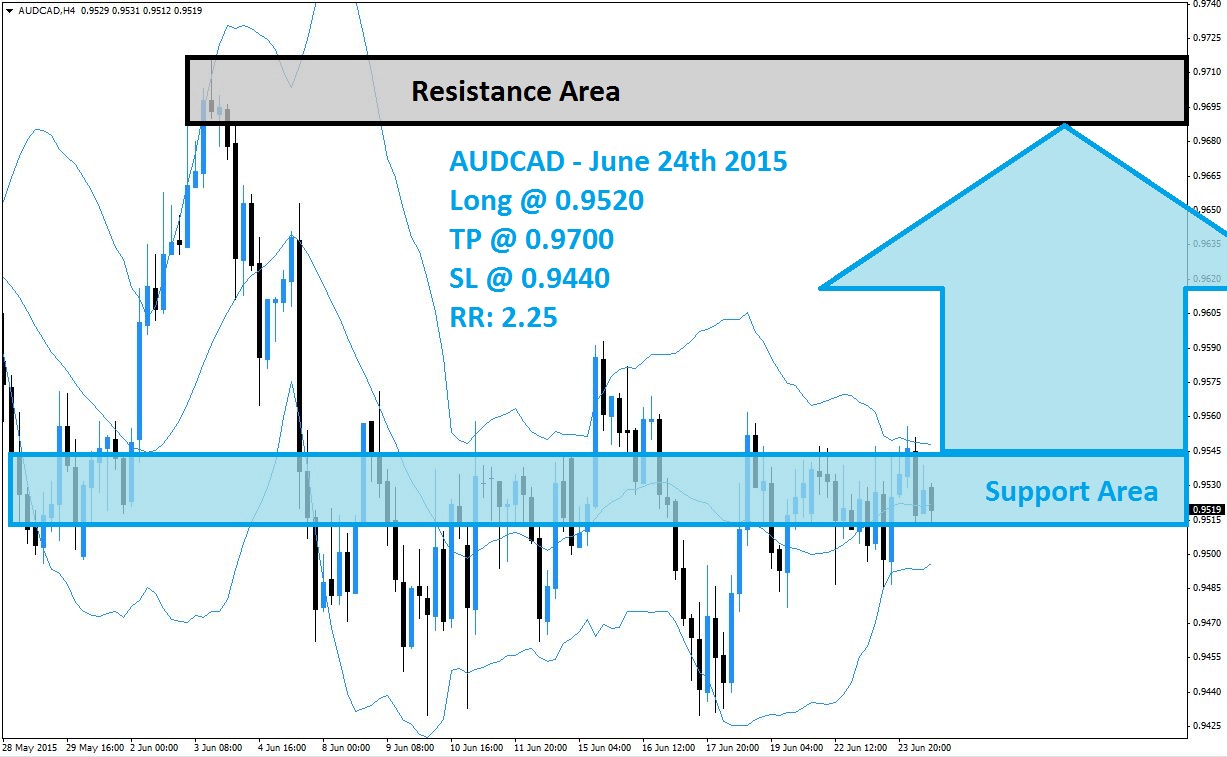
Forex traders are recommended to enter long positions at 0.9520 and below in this currency pair in order to be positioned for the expected short-covering rally. Conservative traders may want to await the breakout above the upper band of its Bollinger Band Indicator before going long in this currency pair. A take profit target of 0.9700 has been set for a potential trading profit of 180 pips on the H4 Chart. More buy orders are likely once the AUDCAD trades above its support area.
Forex traders should protect this trade with a stop loss level at 0.9440 for a potential trading loss of 80 pips which will result in a Risk-Reward (RR) ratio of 2.25.
AUDCAD
Long @ 0.9520
TP @ 0.9700
SL @ 0.9440
RR: 2.25
 (No Ratings Yet)