
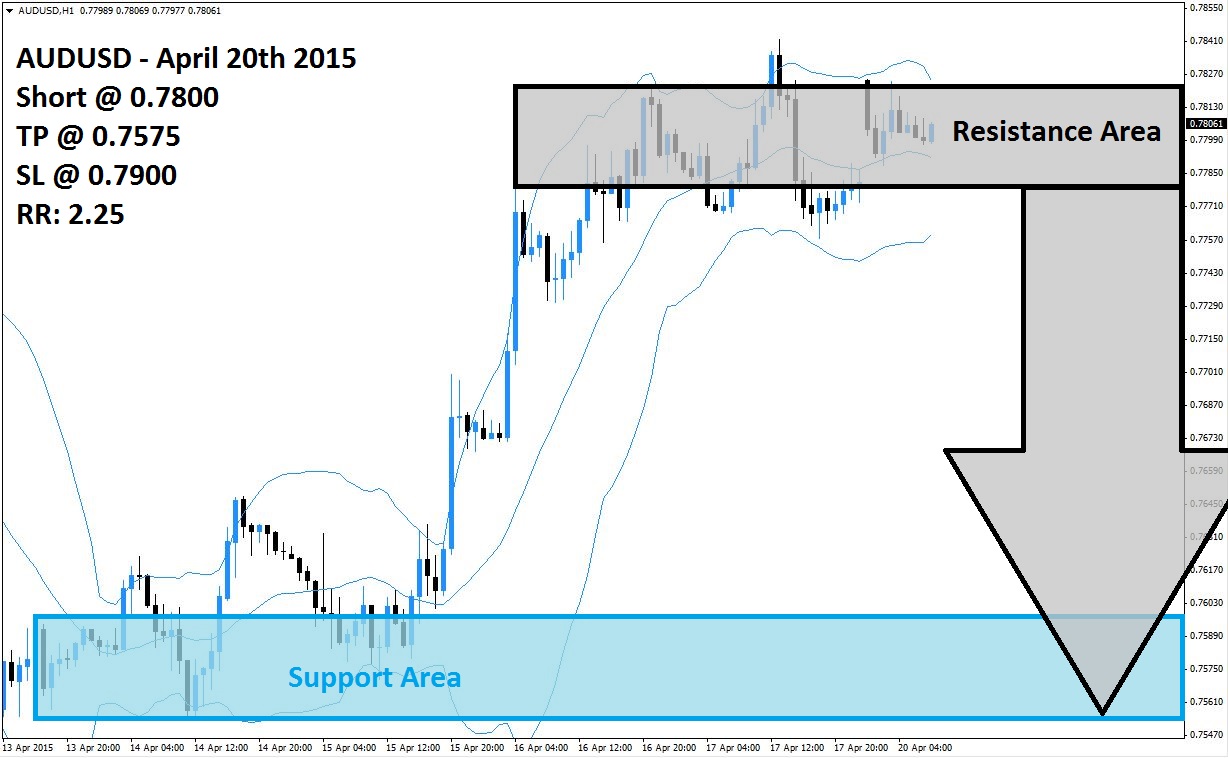
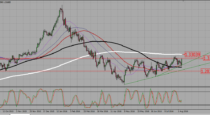
The AUDUSD has started to trend sideways after a strong rally took this currency pair into its resistance area which is visible in light grey in the above H1 chart. The rally was a result of a short-covering rally as forex traders opted to realize floating trading profits after a higher low formed inside of its support area which is visible in light blue. Once the AUDUSD traded above the middle band of its Bollinger Band indicator momentum was strong enough to maintain a level above it.
The Bollinger Band Indicator has support the rally, but now the lower band, middle band as well as upper band have started to trend sideways. The middle band is trending inside of its resistance area while the upper band is trading above its resistance area while the lower band is trading below it. The Bollinger Band Indicator is expected to narrow down until all three bands are trading inside of its resistance area which will increase pressures for the AUDUSD to either attempt a breakout above it or a breakdown below it.
Given the strong advance a breakdown is the most likely scenario and forex traders are recommended to seek out short positions at 0.7800 and above. The narrowing of the Bollinger Band Indicator is expected increase in selling pressure which is likely to merge with profit taking and a breakdown below the resistance area should result in additional short orders in the AUDUSD. A take profit target of 0.7575 has been selected for a potential profit of 225 pips.
Forex traders should protect this trade with a stop loss level at 0.7900 for a potential trading loss of 100 pips which will result in a Risk-Reward (RR) ratio of 2.25.
AUDUSD
Short @ 0.7800
TP @ 0.7575
SL @ 0.7900
RR: 2.25
 (No Ratings Yet)
Add your review