
GBPUSD MONTHLY CHART.

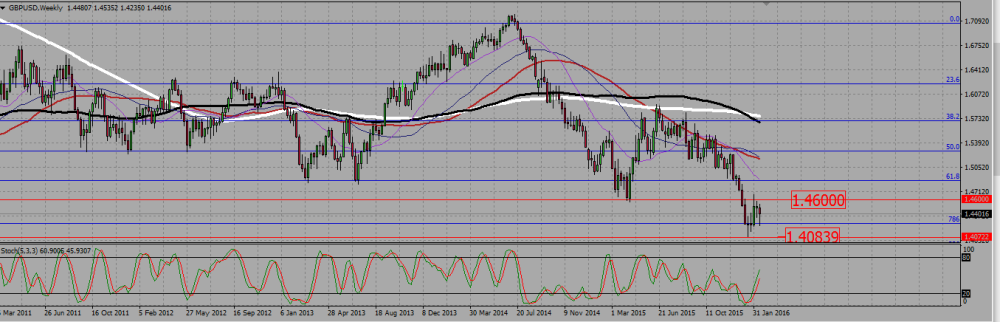
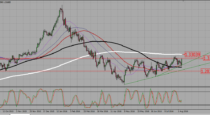
The weekly chart is definitely tricky : the SMAs are pointing down, suggesting a bearish trend. After the rejection of the 0,786 Fibonacci level as a support around 1,425, the cable did not climb significantly higher, but instead it is now coming back down to retest that level. But we are quite low already, all those down wicks I see on the candles rather tell me the cable wants to go up. I prefer to buy signals above the 0,786 fib level.
GBPUSD WEEKLY CHART.
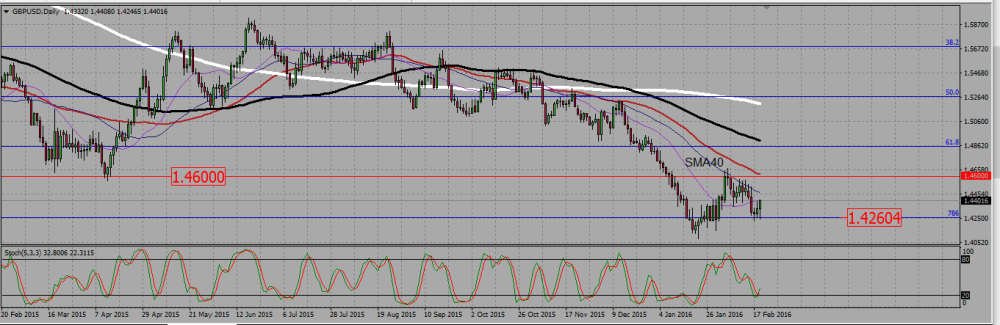
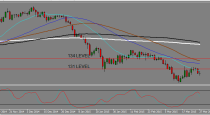
The daily chart shows us a nice hammer rising from the 0,786 Fibonaccci level around at 1,425, therefore I prefer to look long above that level. On the upside we have the 40 SMA that acts as a resistance, and another resistance around 1,46. Those are the two levels we must mind should we enter a long trade. If the 1,425 level break down, I may enter a short trade, but as we are already very low, I will set my TP only at the last low, that is 1,405.
GBPUSD DAILY CHART.
 (1 votes, average: 5.00 out of 5)
Add your review