
1-EU TRADING PLAN.
EU is still in a strong downtrend. We ended the week around 1,05 and that is a level to watch. 1,065 – 1,0675 is a monthly resistance. We will sell rallies under 1,0675 towards parity. Watch 1,05 support level to get a clue whether we are going to retest 1,065 resistance again or not. Above 1,0675 (very unlikely), try to buy dips towards 2,0.
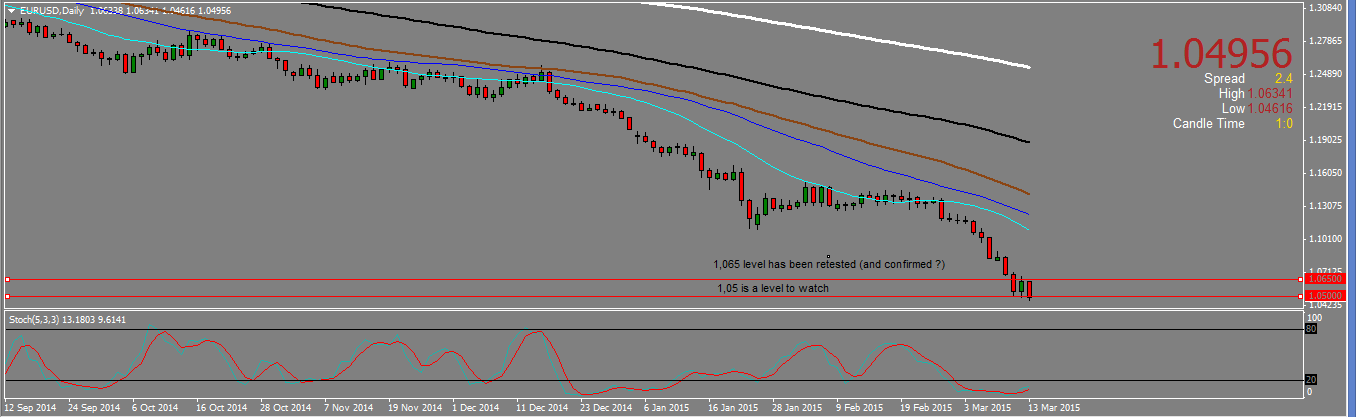
On the daily chart, the pair reached the 1,05 level support before consolidating back to 1,0675 on Thursday. It finished the week with a retest of the 1,05 low, slightly closing under it at 1,0496.
EU DAILY CHART.
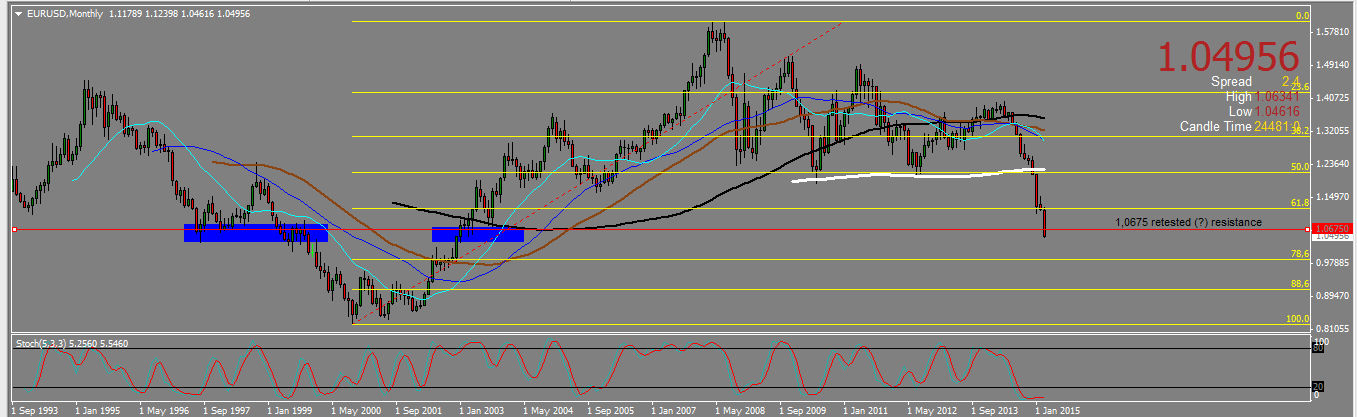
On the monthly chart, we see that the resistance that has been reached during Thursday consolidation is a monthly support level that has been broken down. That consolidation could therefore be just a retest, although it is still too early to be sure if that retest is over or not.
EU MONTHLY CHART.
2-EURAUD TRADING PLAN.
The pair entered a downtrend on the daily chart, making lower lows and a lower high. It also broke down the 1,38 level that is now resistance. EURAUD is however approaching strong supports on the weekly and the monthly time frame, roughly around 1,37, and those support levels should be checked for a potential bullish reversal or consolidation even back to 1,385.
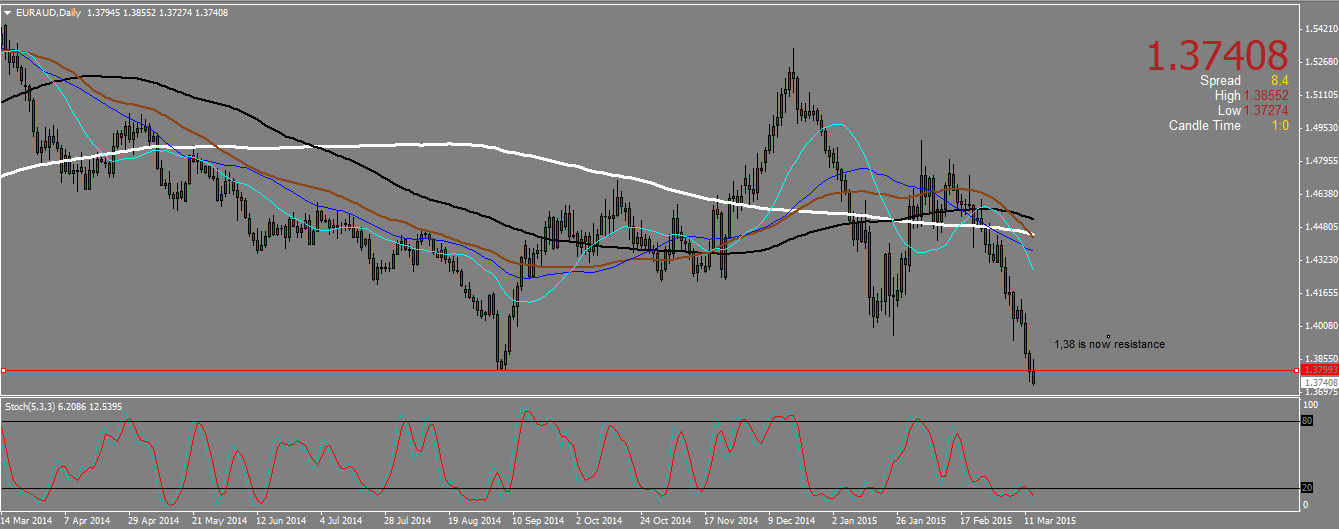
On the daily chart, the pair is starting a downtrend. It broke the last daily low around 1,38 and is now heading south.
EURAUD DAILY CHART.
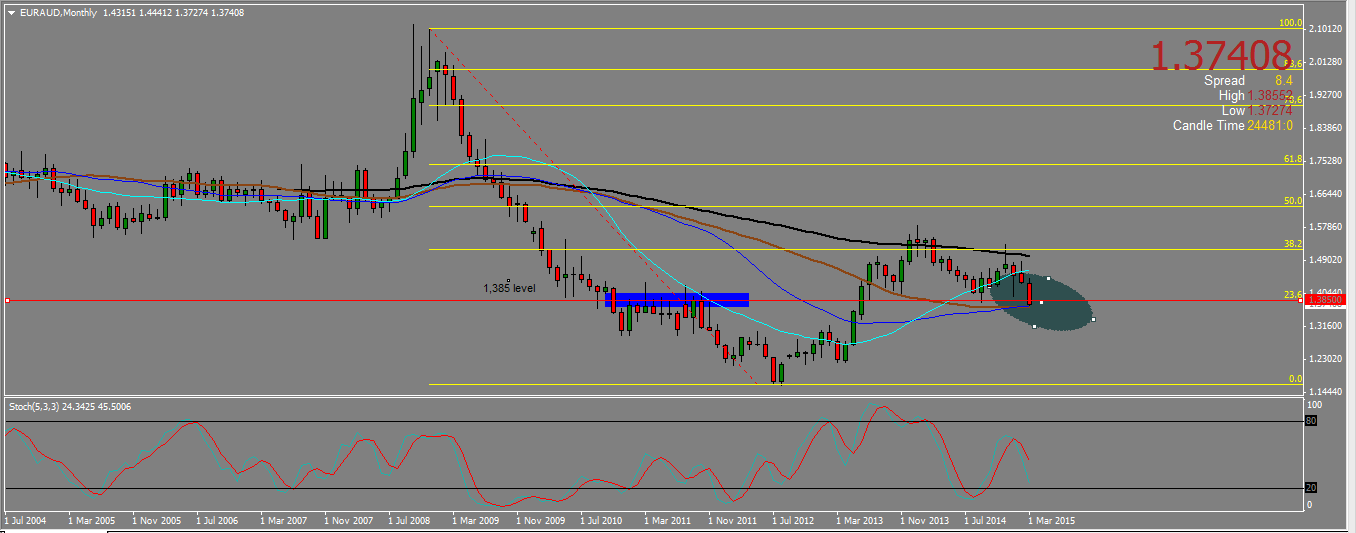
But on the monthly chart we see EURAUD is reaching both monthly SMA55 and SMA40 around 1,37. There is also the 23,6 fib line broken support that may be retested as a resistance around 1,385. That level seems quite a good resistance.
EURAUD MONTHLY CHART.
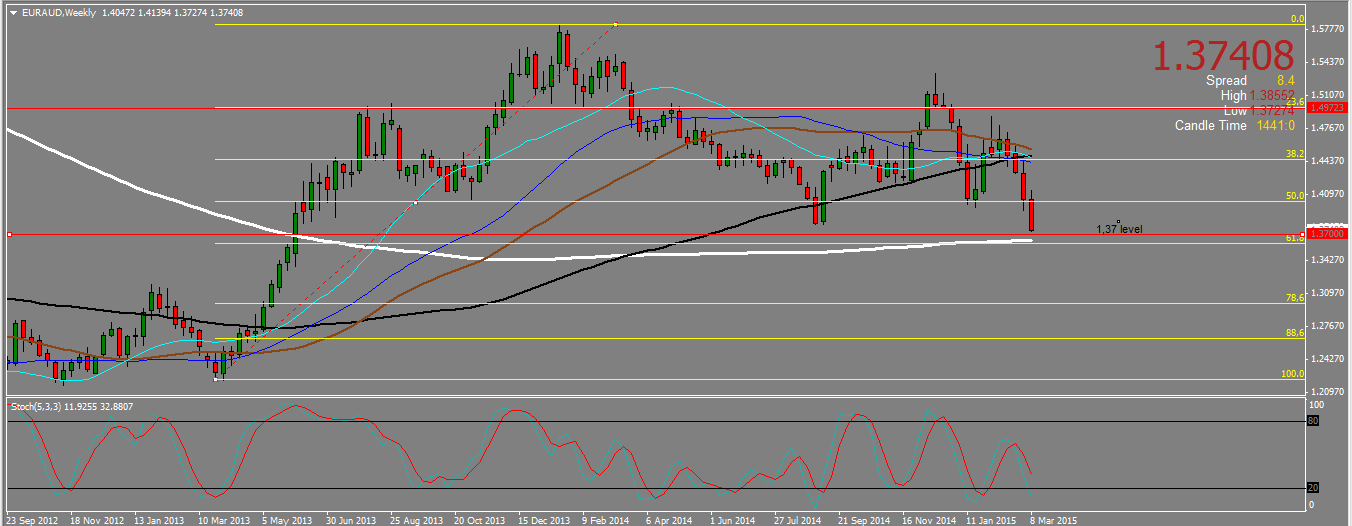
On the weekly chart, the pair is also approaching the SMA200 support slightly under 1,37 -Friday close-. This is also a support that may be difficult to pass.
EURAUD WEEKLY CHART.
3-GBPCAD TRADING PLAN.
Sell rallies up to 1,9 -1,95 aiming at 1,85. Look for bearish signals around 1,89 -1,90 resistance area.
The monthly chart shows an evening star in progress, rejecting a 50 fib line resistance around 1,955. The next fib line support is the 38,2 around 1,85 that should be our target.
GBPCAD MONTHLY CHART.

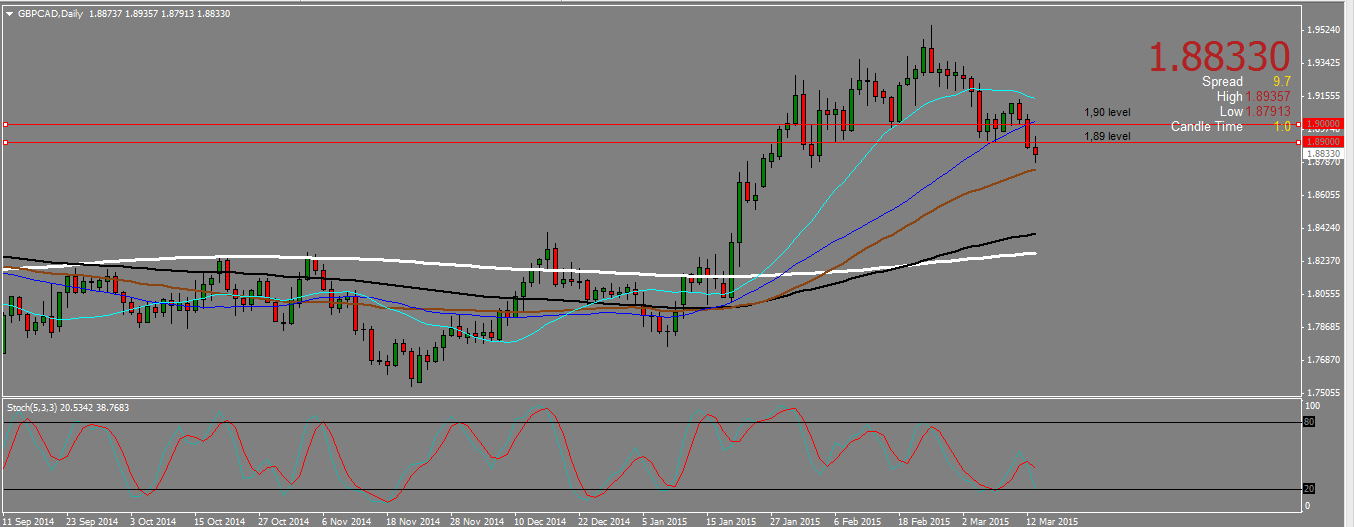
As we do not want to sell a low, we will wait for a pull back to enter short. From the daily chart, the most probable area is the 1,8 9- 1,90 one. This would be a perfect place to enter short on a retest and a bearish signal.
GBPCAD DAILY CHART.
 (No Ratings Yet)


Add your review