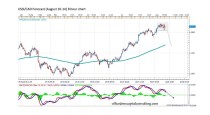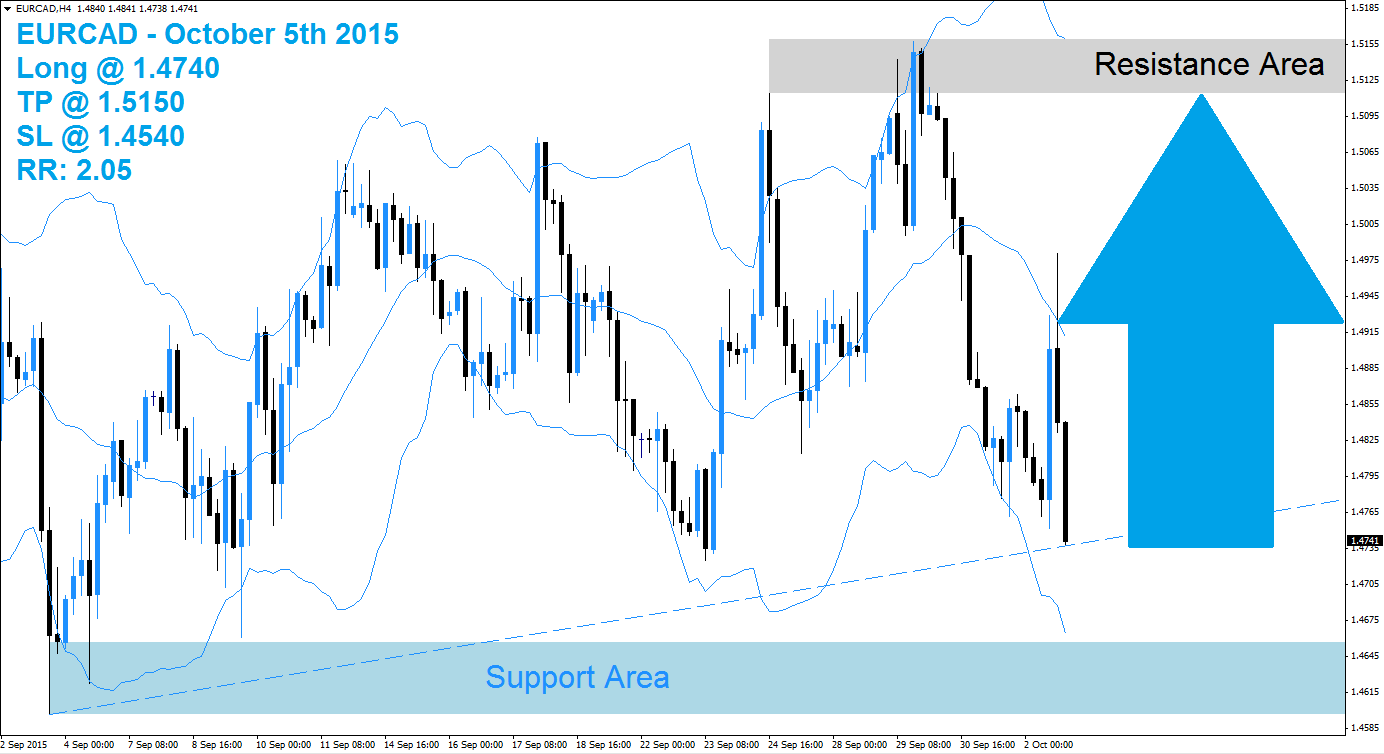
The has sold off from its resistance area which is marked in light grey in the above H4 chart and is now trading at an upward sloping support level. This currency pair may attempt a breakdown into its support area which is marked in light blue, but the overall risk remains to the upside as more volatility should be accounted for. The Bollinger Band indicator has confirmed the sell-off as all three bands are sloping to the downside.
The upper band of the Bollinger Band indicator was able to breakout above its resistance area, but started to reverse the breakout. The EURCAD is trading between the lower band and the middle band of the Bollinger Band indicator, but forex traders may opt to realize floating trading profits and close their existing short positions. This could take the EURCAD above the middle band of the Bollinger Band indicator.
Forex traders are advised to seek long positions at 1.4740 and below this level in order to take advantage from the expected short-covering rally. Conservative forex traders should wait for a breakout above the middle band of it Bollinger Band indicator before entering their long positions. A take profit target of 1.5150 has been set for a potential trading profit of 410 pips on the H4 Chart. More buy orders are expected after the EURCAD completes its breakout above the middle Bollinger Band.
Forex traders should protect this trade with a stop loss level at 1.4540 for a potential trading loss of 200 pips which will result in a Risk-Reward (RR) ratio of 2.05.
EURCAD
Long @ 1.4740
TP @ 1.5150
SL @ 1.4540
RR: 2.05
 (No Ratings Yet)