1-EURUSD trading plan.
Buy pull back to H4SMA200 towards 1,115 and 1,13. Sell bearish breakout of H4SMA200 towards 1,0725 and then 1,06. Buy confirmed break out of 1,1 for further bullish consolidation.
Since it reached a low of 1,045 three weeks ago, the eurodollar rallied around 500 pips. On the daily the pair is trying to break up the 1,1 level, but the SMA40 that came as a resistance does not allow the up move to developp.
EU DAILY CHART.

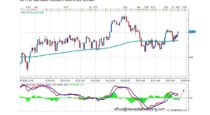
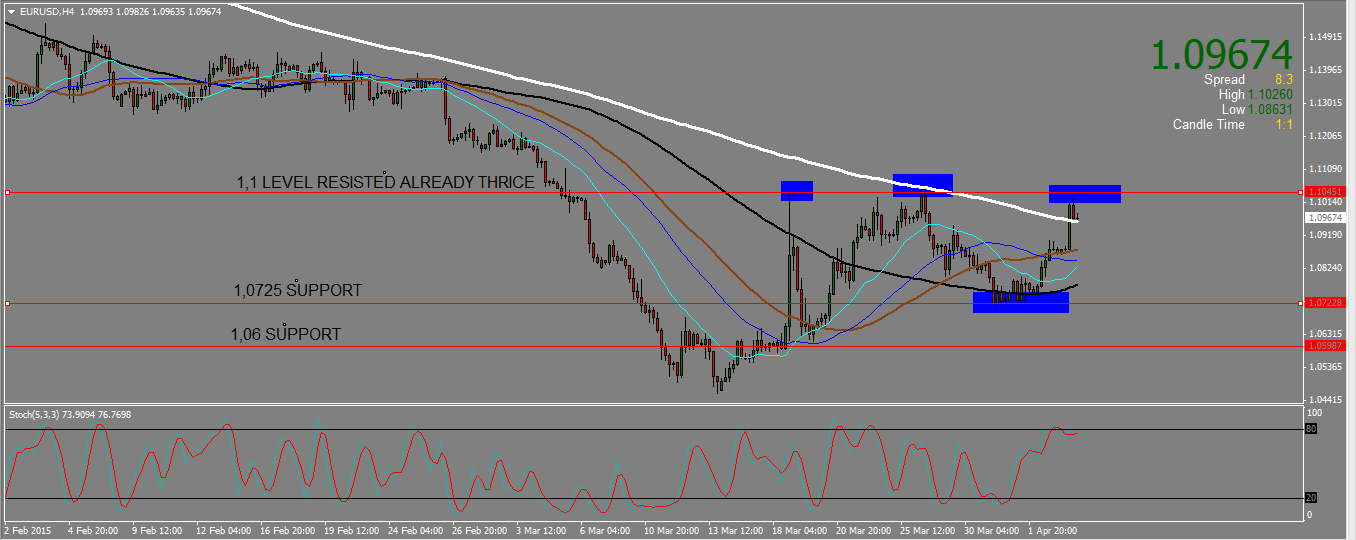
On the H4 chart, the pair broke up SMA200 and went down to retest it. Depending upon the level at which the eurodollar will open on Monday, this SMA seems a good spot to watch for a bullish break out or a bearish reversal. The chart also shows 1,0725 and 1,06 to be good take profit levels in case of a bearish reversal.
EURUSD H4 CHART.
2-AUDUSD trading plan.
Expect a limited bounce from a range support around ,76, probably no higher than ,775, then looks for short signals towards ,70.
On the weekly chart the pair is retesting a range support around ,76. the range resistance is a 61,8 fib line level at ,795.
AUDUSD WEEKLY CHART.

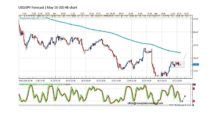
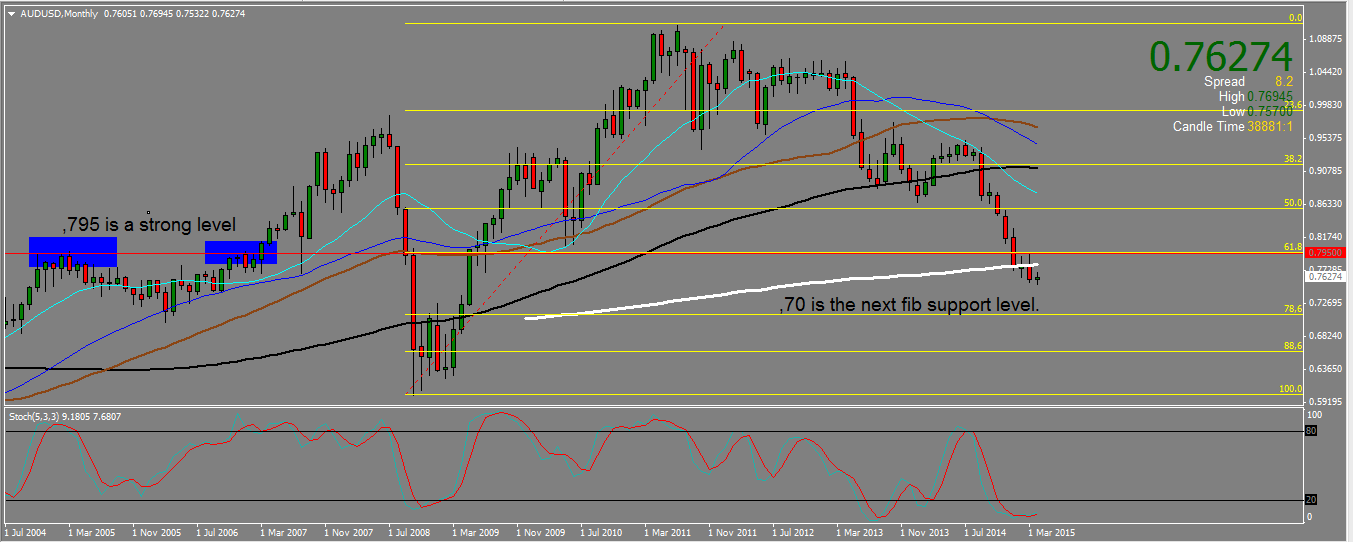
We will probably bounce from that support but the last daily candle (Friday) is a weak bullish pin bar with a very long upwick rejecting the SMA20 around ,77. That candle even closed under a former broken daily support around ,764. We therefore expect the bounce to fail and will rather look to enter short under ,775 (monthly SMA200) towards the next monthly fib support that is the ,786 fib line support around ,70.
AUDUSD MONTHLY CHART.
3-GBPCAD trading plan.
The pair may move down a little bit more, but look for long above 1,83 (and even 1,80) towards 1,93.
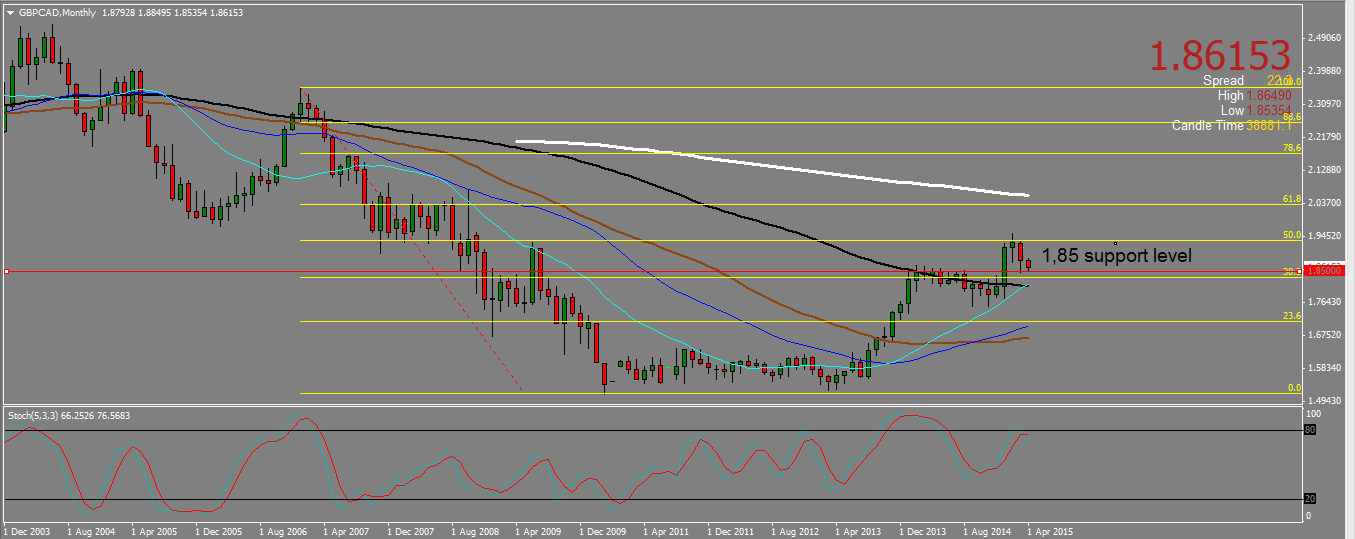
On the monthly the pair completed a bearish harami, falling from the 50 fib level around 1,94. It is now approaching a strong support zone around 1,855. The SMA100 and SMA20 offer also support around 1,80.
GBPCAD MONTHLY CHART.
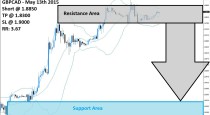
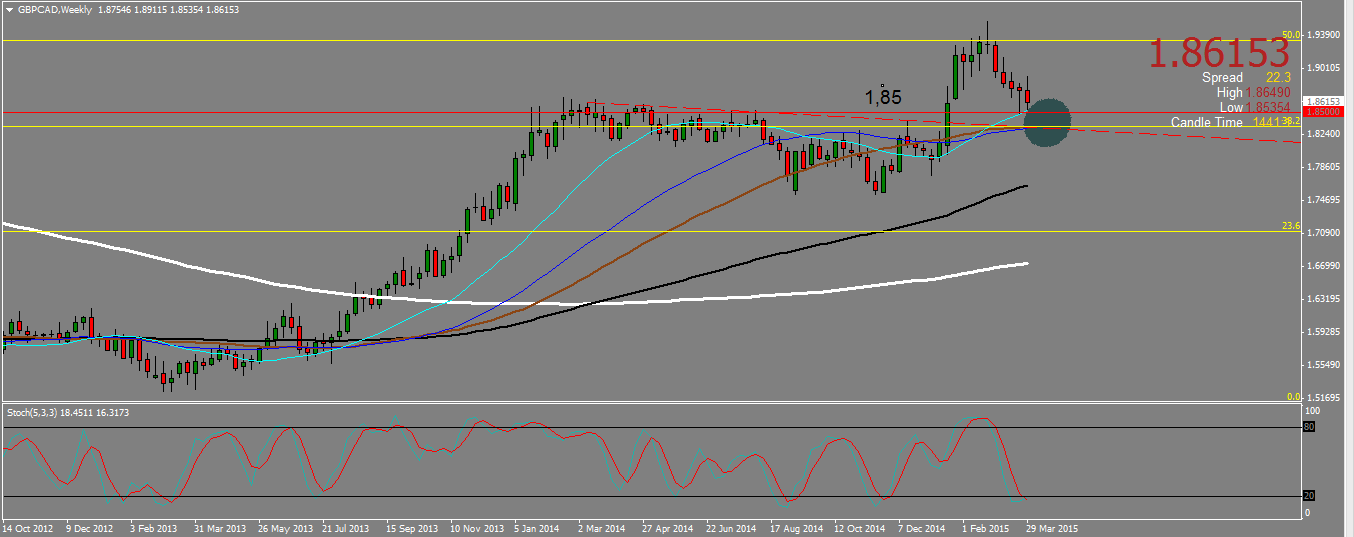
The weekly chart shows how strong that support zone is. At 1,833 we have the confluence of the 61,8 monthly fib level, a descending trend line support, and two SMAs (40 and 55). This should be very tough to break.
GBPCAD WEEKLY CHART.
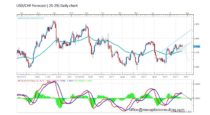
Finally the daily chart gave a morning doji star, which bears bullish implication, rising fro the 1,85 level. It also shows us two additional supports in the zone with the SMA100 near 1,85 and the SMA200 around 1,83.
GBPCAD DAILY CHART.
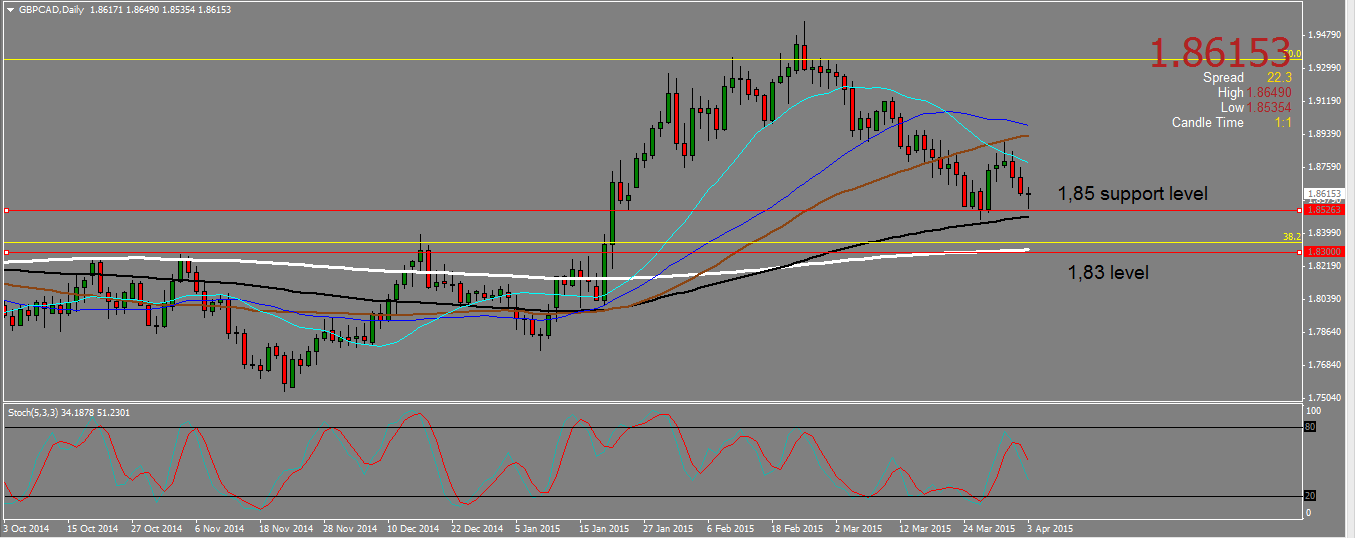
This is why we will be looking to buy dips down to 1,80, aiming at the 50 monthly fib resistance level around 1,94.
 (1 votes, average: 5.00 out of 5)