Good opportunities for entry next week. Forex Weekly Technical Analysis based on the Support, Resistance levels, Trend lines, EMA.
(Forex weekly forecast by Camilo R.)
Helpfull links: Real Time Forex Charts (Live), Forex Economic Calendar news (Live)
EUR/GBP Weekly Forecast
Monthly Chart:
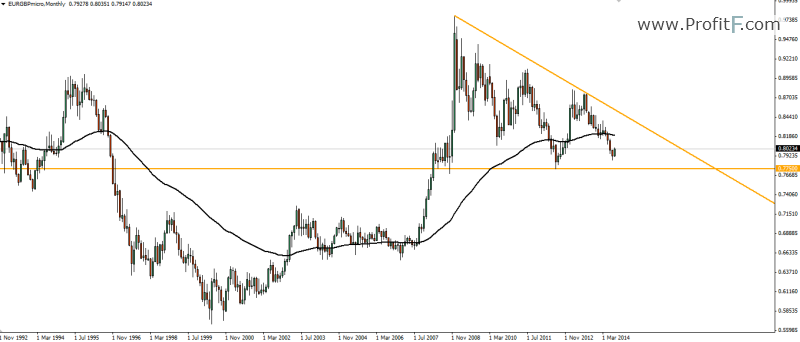 At monthly chart we can see a down triangle formed with a downtrend line and a support line at 0.7750.
Weekly Chart:
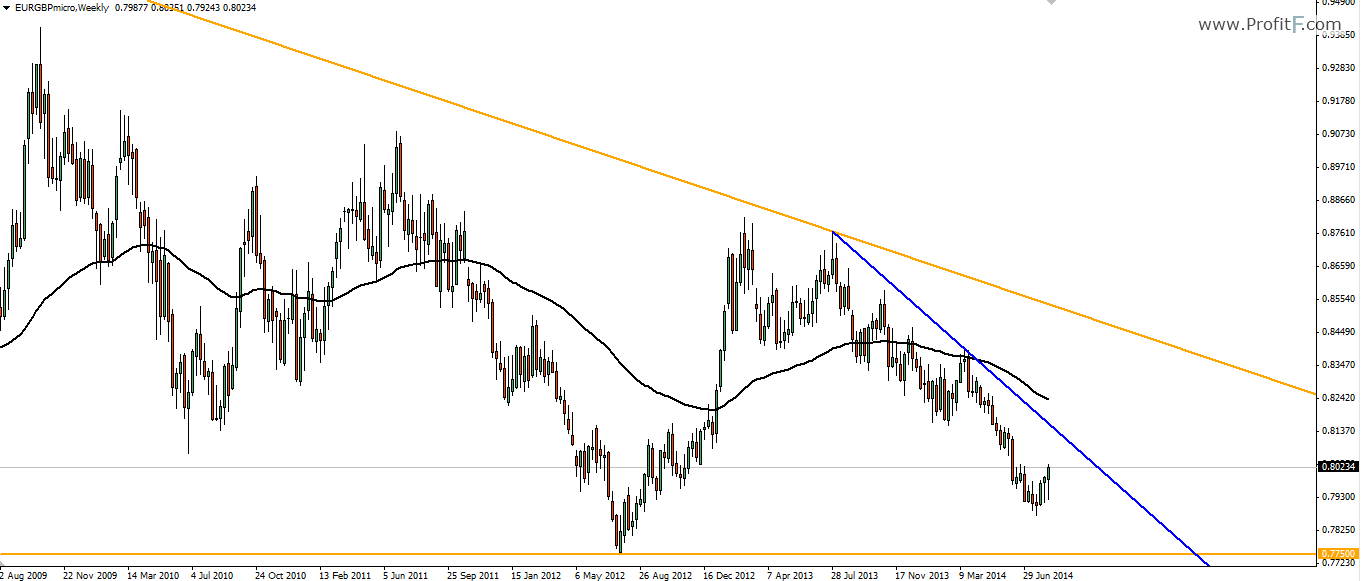
Just one thing to care at weekly chart, a down trend line.
Daily Chart:
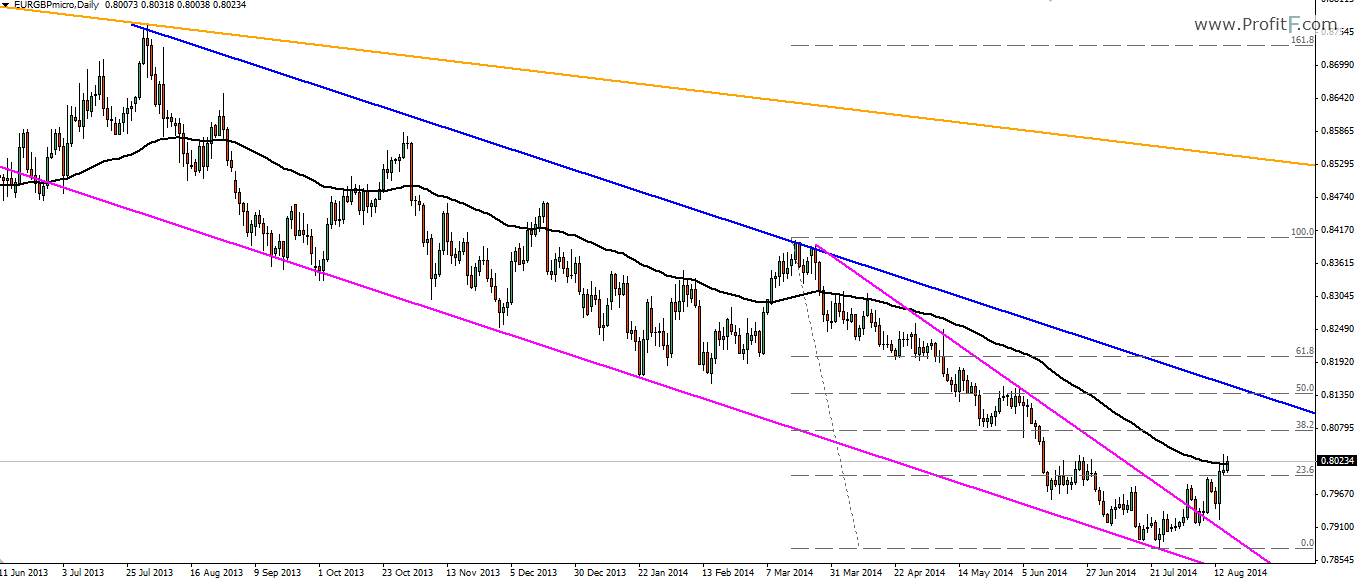
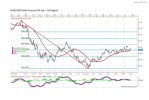
At daily chart we can use a parallel line of the weekly downtrend line to create a channel. The daily downtrend line finally was broken and now we are able to use the Fibonacci Retraction to find good areas to entry. By now the EMA72 is holding the pair but probably he don’t will stop until the up border of the channel. Areas around 50% or 38.2% in confluence with the channel is the best for short next week.
GBP/JPY Weekly Forecast
Monthly Chart:

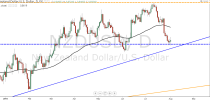
At monthly chart the only thing we must care is the support zone at 160.00.
Weekly Chart:
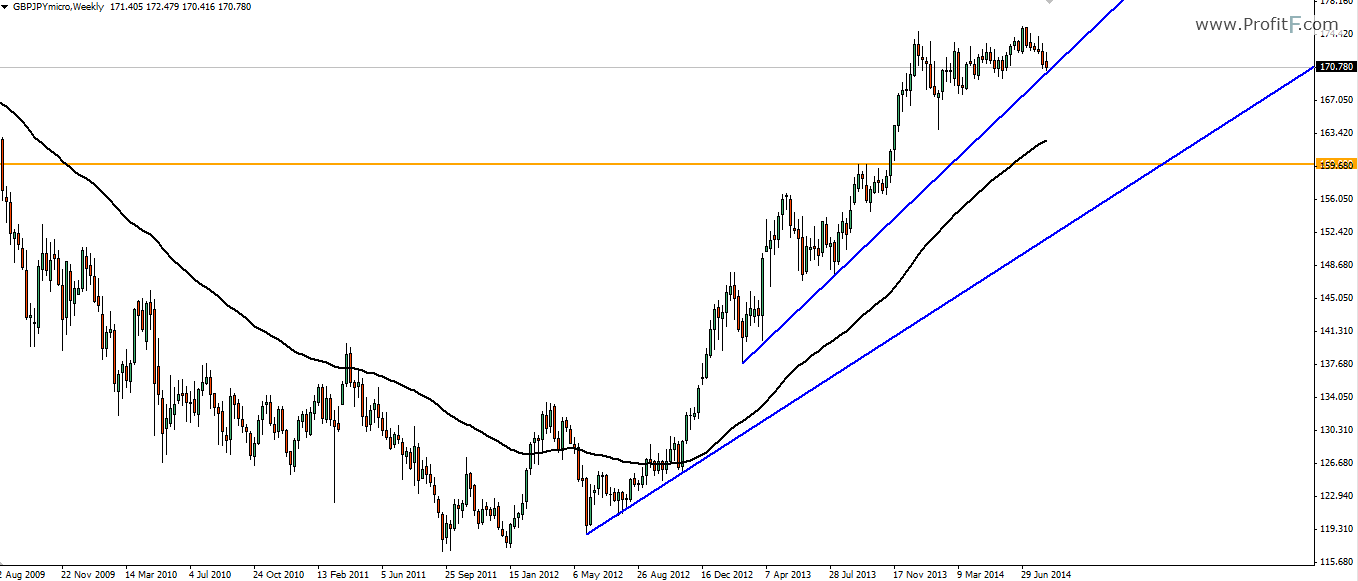
At weekly chart we have two uptrend lines, one is very close the actual price.
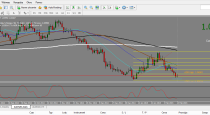
Daily Chart:
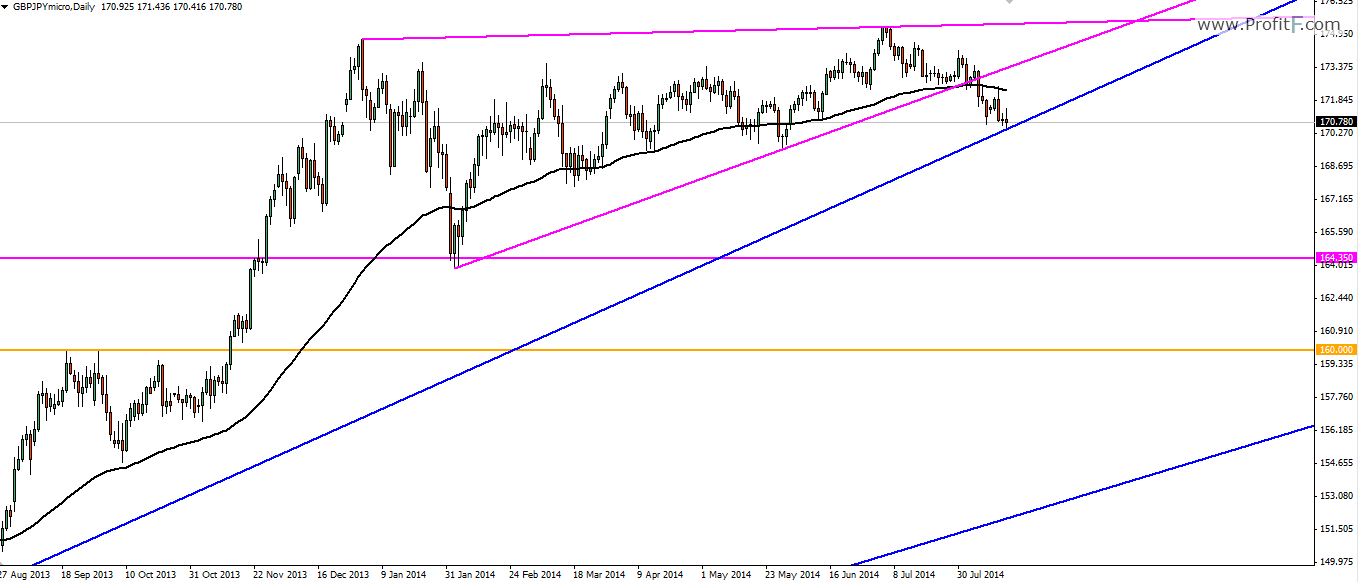
At daily chart we have a broken triangle, unfortunately it was not possible to enter in your break because the weekly uptrend line. If this week the pair is able to break this line the next important support is at 164.35.
NZD/USD Weekly Forecast
Monthly Chart:

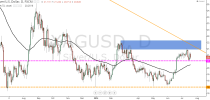
At monthly chart we must care about the historical high at 0.8841 where price touched for the second time last month and had no strength to break.
Weekly Chart:
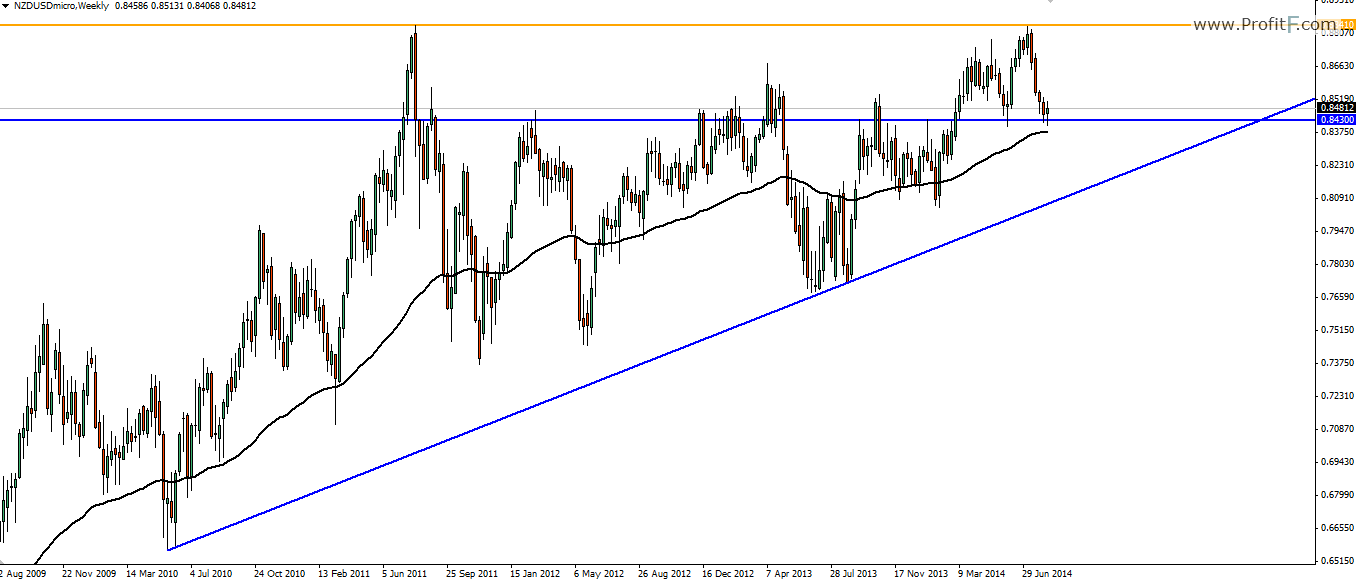
The weekly chart show us a uptrend line and the support area at 0.8430 in confluence with EMA72.
Daily Chart:
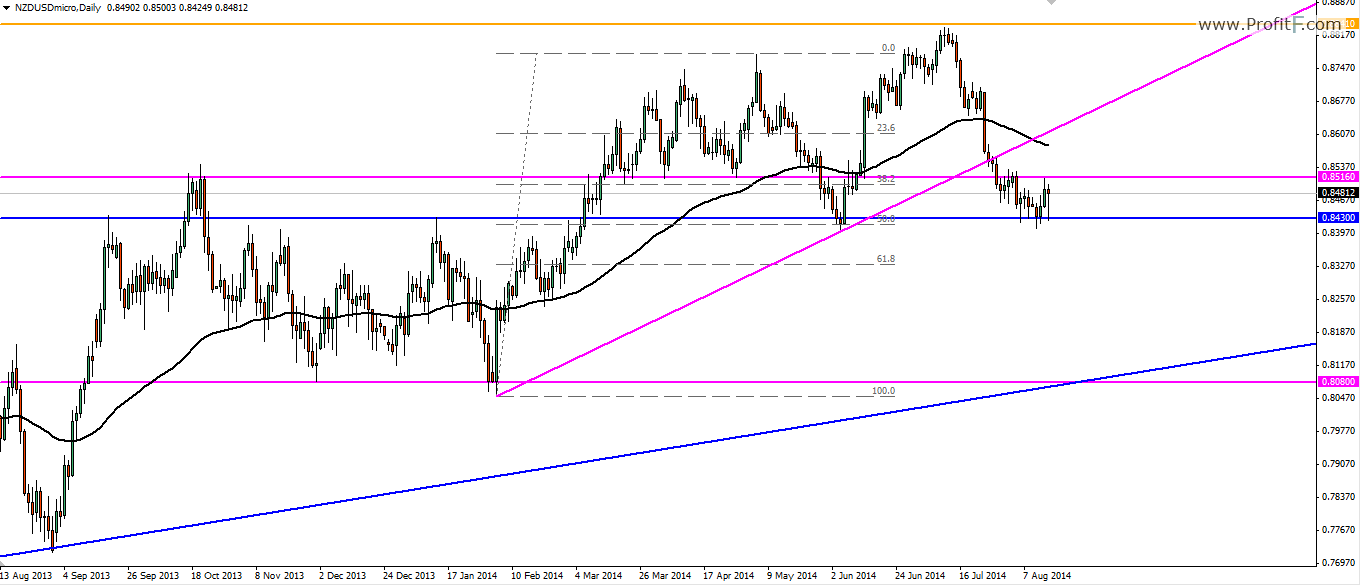
At daily chart the price is tied between the weekly support and the daily resistance. The daily uptrend line don’t was a problem for the price. The last Fibonacci retraction show us some important thing, after done the 50% retraction the price break the last high but don’t was able to keep rising, probably the new Fibonacci Retraction will be a down and we must imagine two possible scenarios for the NZD/USD.
The first one is, the price will respect the weekly support, break the daily resistance and do the pull back at the trend line before down.
And the second one, the price will break the weekly support and fall until the daily support or the weekly uptrend line.
 (No Ratings Yet)