
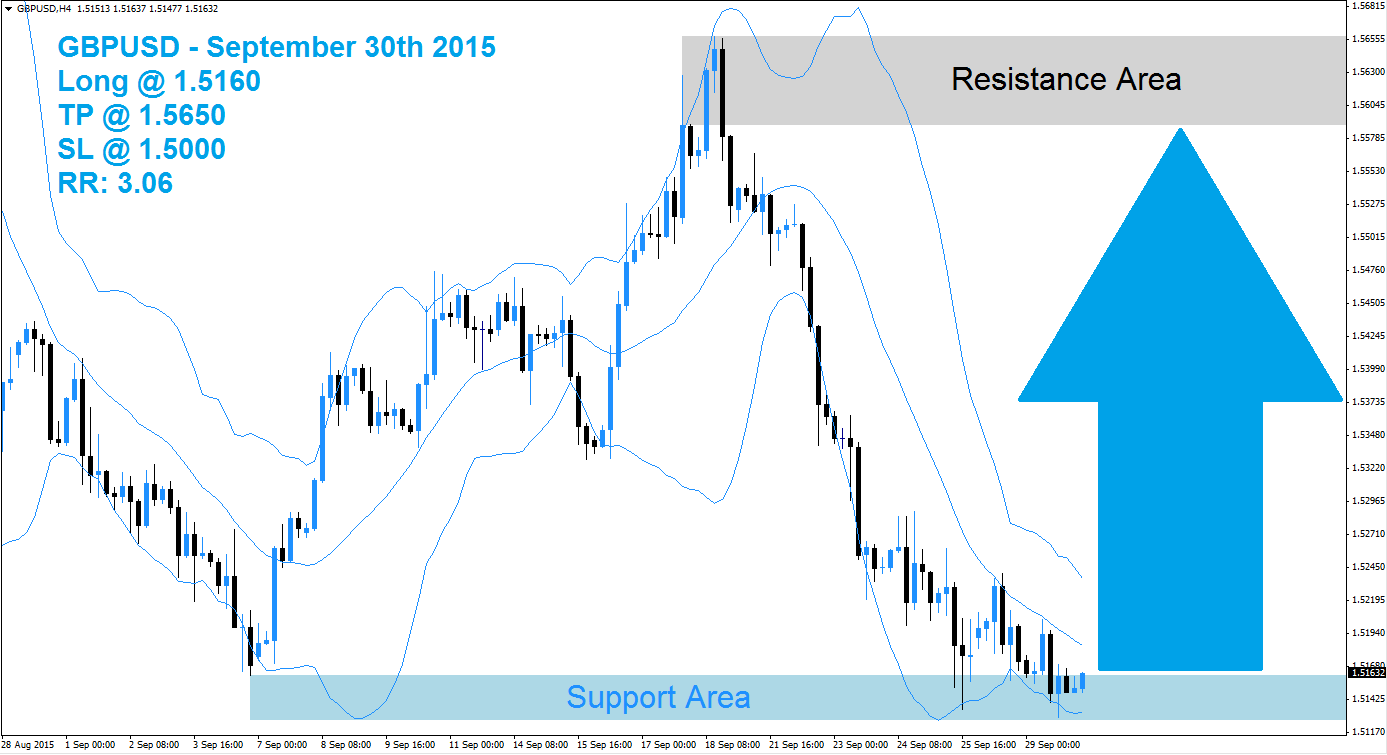
The GBPUSD has sold off from its resistance area marked in light grey in the above H4 chart back down into its support area visible in light blue. The Bollinger Band indicator broke out above its resistance area on two occasions, but has followed the price action collapse in this currency pair. All three bands of the Bollinger Band indicator are sloping to the downside and the GBPUSD is trading between the lower band and the middle band, inside of its support area.
Forex traders are expected to take profits after the strong sell-off and exit their short positions which will lead to a short-covering rally. A breakout above the upper band of the Bollinger Band indicator is also expected to result in the addition of new net long positions which can extend the short-covering rally into a full reversal back into its resistance area. The upside potential in the GBPUSD is very attractive and counterweights any potential move lower.
Forex traders are advised to seek long positions at 1.5160 and below this level in order to take advantage of the expected short-covering rally. Conservative forex traders should wait for a breakout above the middle band of it Bollinger Band indicator before entering their long positions. A take profit target of 1.5650 has been set for a potential trading profit of 490 pips on the H4 Chart. More buy orders are expected after the GBPUSD completes its breakout above the middle Bollinger Band.
Forex traders should protect this trade with a stop loss level at 1.5000 for a potential trading loss of 160 pips which will result in a Risk-Reward (RR) ratio of 3.06.
GBPUSD
Long @ 1.5160
TP @ 1.5650
SL @ 1.5000
RR: 3.06
 (No Ratings Yet)

Add your review