Subscribe to Updates (Weekly forex analysis by Stephen L) via Email
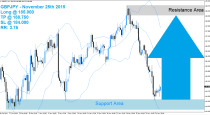
The cable is still a sale, but wait for a pull back to a resistance and then a clean selling signal to enter a trade.
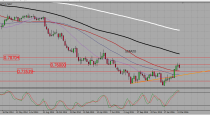
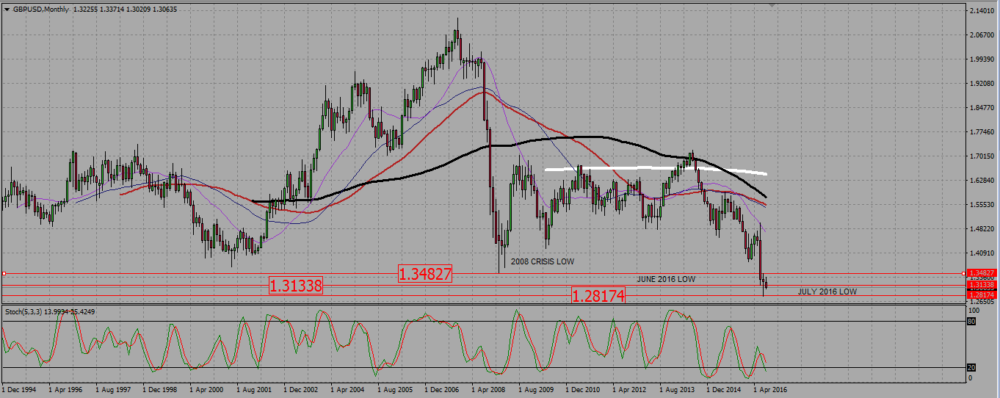
On the monthly chart, and after breaking down the 2008 crisis low in June, the pair fall even further and reached a low slightly above 1,28 in July. But it ended that month with a kind of doji, end even went back above the 2016 June low around 1,3140. It has started the month on a bearish mode, breaking back down the 2016 June low.
GBPUSD MONTHLY CHART.
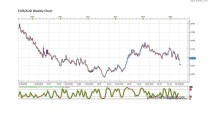
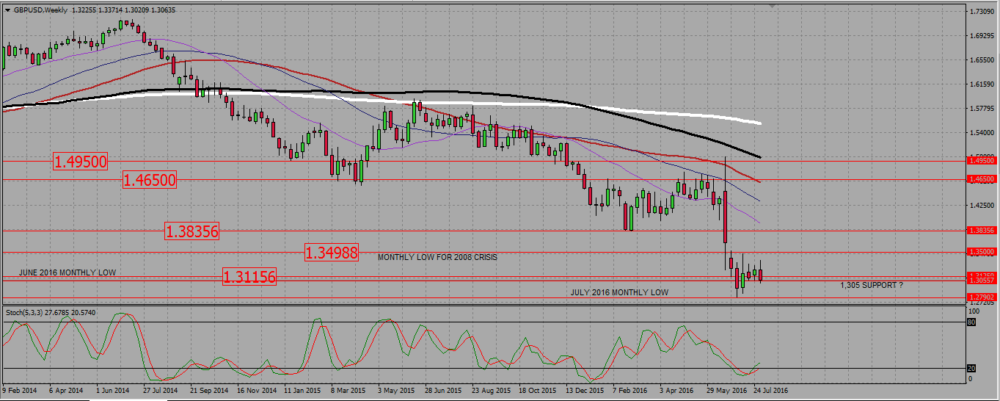
The cable is in a bearish trend on the weekly chart. We see that after falling to a new low on the first week of July 2016, the pair tried to rally on the following week, and managed to take back the low of June 2016, reaching as high as the low of the 2008 crisis around 1,35. ( about Fundamental analysis – read our weekly Major economic news Next week) Since that week, it has trade within that bullish candle. The last candle is a clear bearish one, and it would have even qualified as a bearish engulfing, except that there is no previous bullish consolidation. Nonetheless, this week may be considered as bearish.
GBPUSD WEEKLY CHART.
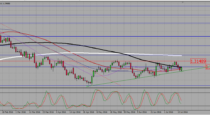
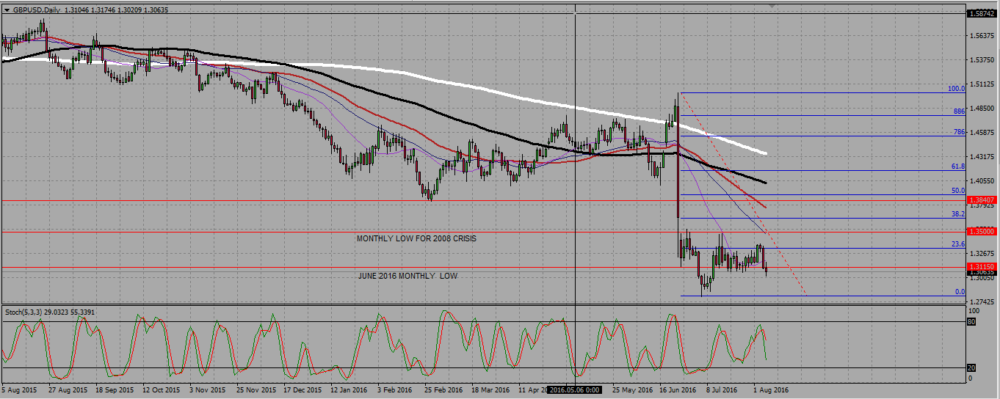
On the daily chart, we see that during the mini bullish rally during the second week of July the pair took the June 2016 low around 1,31 on July the 12th. Since then, it has traded above that value, until last Friday, on August 5th where it closed under it. The cable will most probably keep going down to retest the July low around 1,28, but do not sell a simple break down at such low levels. You need to wait for some kind of pull back to a resistance before entering a trade.
GBPUSD DAILY CHART.
 (1 votes, average: 5.00 out of 5)