
FREE – Subscribe to updates (Forex analysis from this author) via Email
Not the best pair to trade this week. I will buy signals around 1,405, with a take profit around 1,466. I will only sell break down – pull back – confirmation signals up to 1,466. Above 1,466, I will buy break up – pull back – confirmation signals.
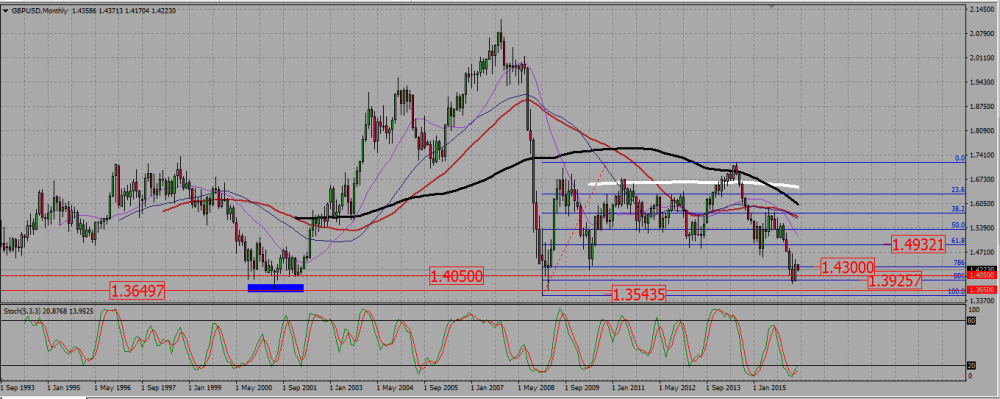
On the monthly chart, the pair looks rather bearish, but rejecting a support near 1,40 – 1,4050 last month, and climbed back towards a Fibonacci resistance level near 1,43. That zone, up to 1,47, has been a strong support zone in the year 2000 – 2002. It is now a strong resistance zone.
GBPUSD MONTHLY CHART.
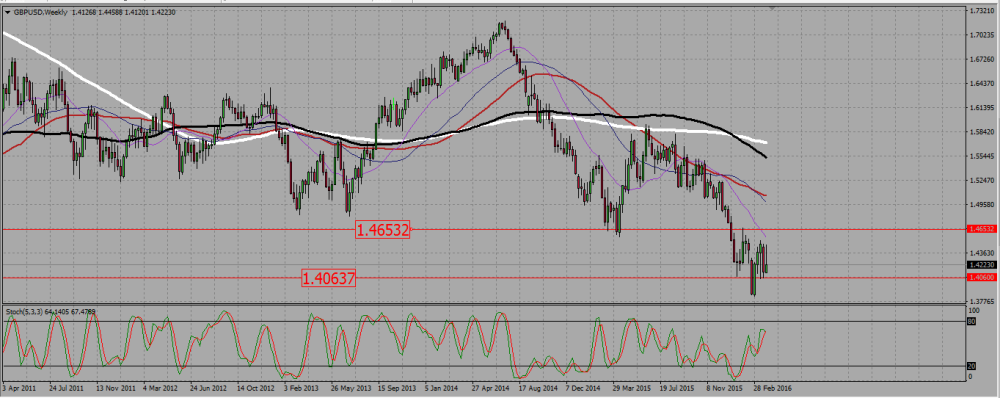
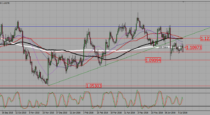
The weekly chart shows us a bearish environment, with SMAs starting to point down. We see the rejection of the 1,405 support, but the pair seems to have difficulties to go up, seeing what the last three candles look like. 1,465 seems to be a strong resistance.
GBPUSD WEEKLY CHART.
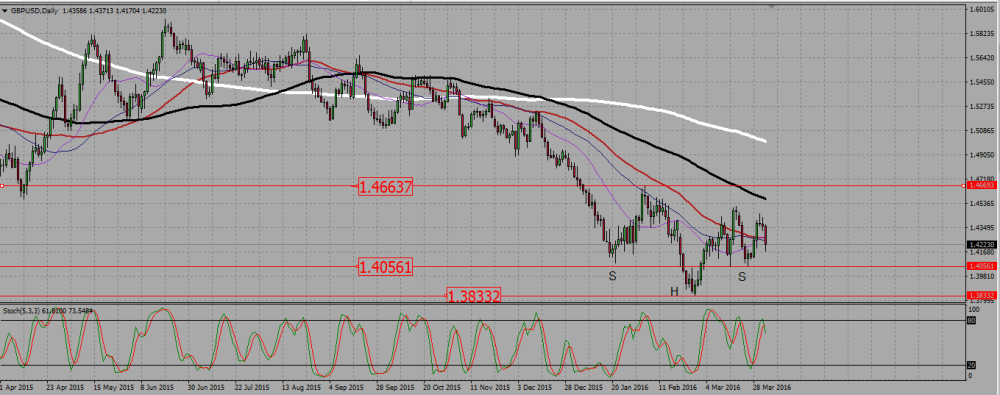
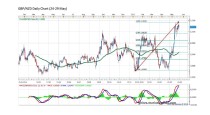
The daily chart shows us the pair consolidating above the 1,405 support, after a false bearish break out of it. There is a potential inverted head and shoulder, which needs 1,466 to be broken up to be validated, and this is still 400 pips above the cable current value. Between those two values, anything may happen.
GBPUSD DAILY CHART.

 (4 votes, average: 4.50 out of 5)
Add your review