FREE: Subscribe to this Weekly Forex analysis if you like this trading plan 😉
GBPUSD trading plan.
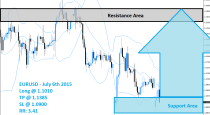
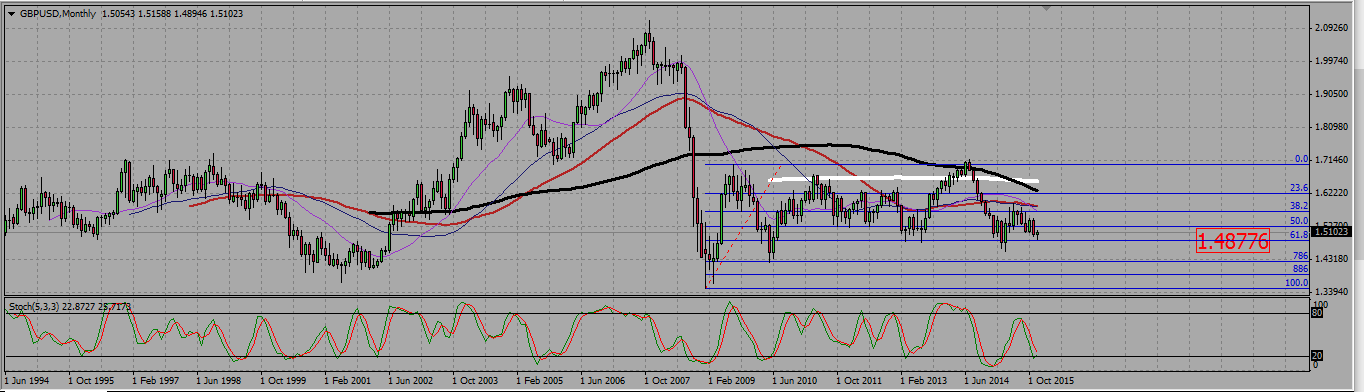
Buy signals above 1,49 towards 1,52-1,53. Watch for selling signals there (resistance of a bullish flag…All about Flag pattern>>). On the monthly chart, the pair is retesting, and looks like it wants to reject a support near 1,49.
GBPUSD MONTHLY CHART.
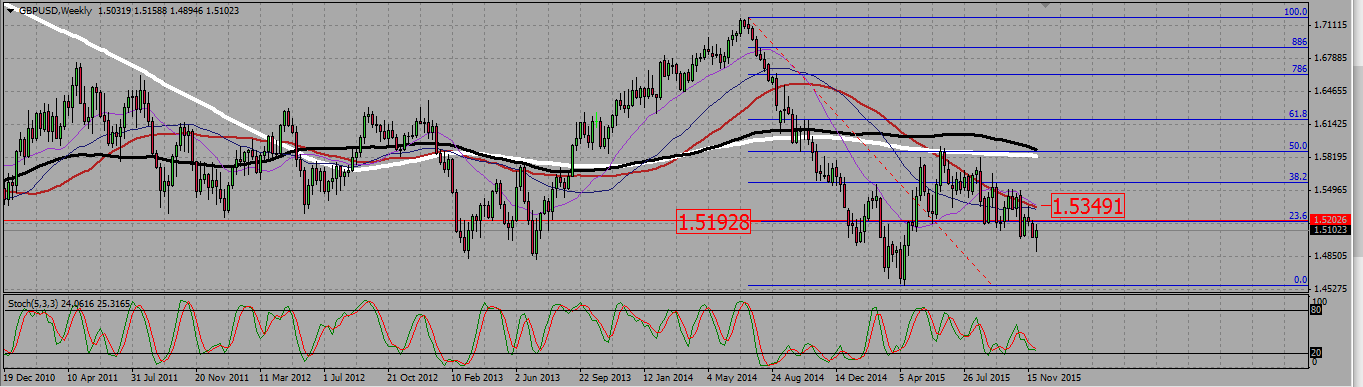
On the weekly chart, we see a hammer under a resistance line around 1,52. There is also a bullish stochastic divergence, with the indicator bouncing from the oversold position (20), while the pair is still going down. I will buy pullbacks above the 1,49 support line, with a take profit level around 1,52.
GBPUSD WEEKLY CHART.
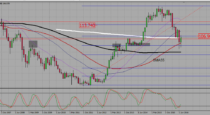
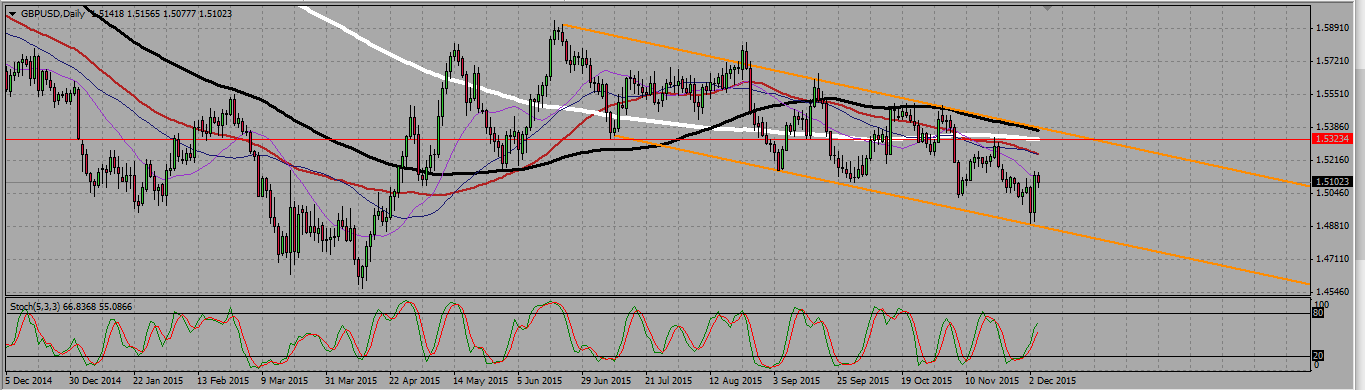
Finally, the daily chart shows the cable rising from the support of an ugly bullish flag, with an engulfing candle followed by a tiny spinning top. the flag resistance is in the 1,52-1,53 area. A bearish signal in that zone would mean I have to close any long trade.
GPBUSUD DAILY CHART.
USDJPY trading plan.
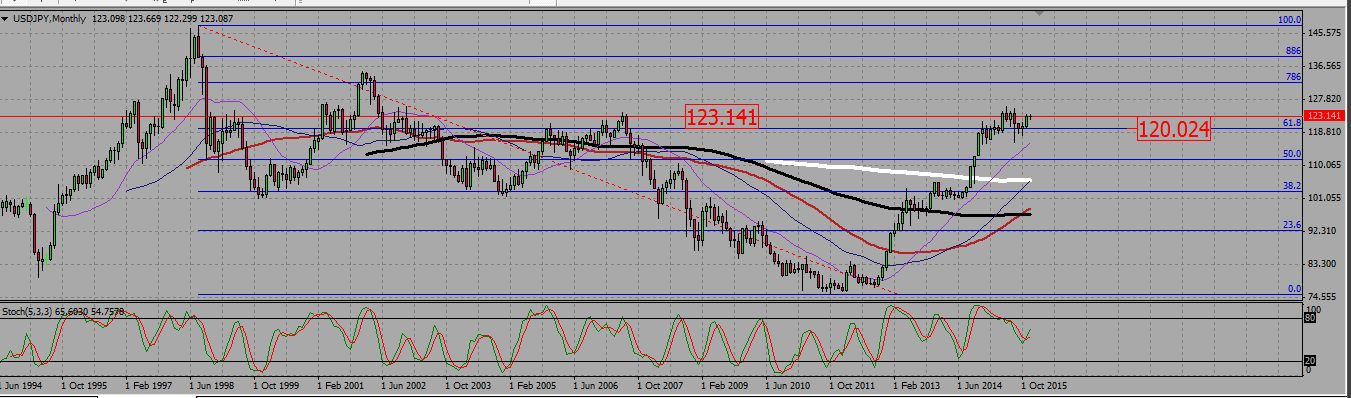
Above 121,5, prefer to buy signals to resume a long term bullish trend, but allow for a pull back first, as we are upon a resistance. Take profit (resistances) at 123,25, 124,25, 125,25
On the monthly chart the pair is in the process of confirming a bullish break out of a Fibonacci level around 120. It is however facing a resistance with a former monthly high around 123,1, and may still reverse on it.
USDJPY MONTHLY CHART.
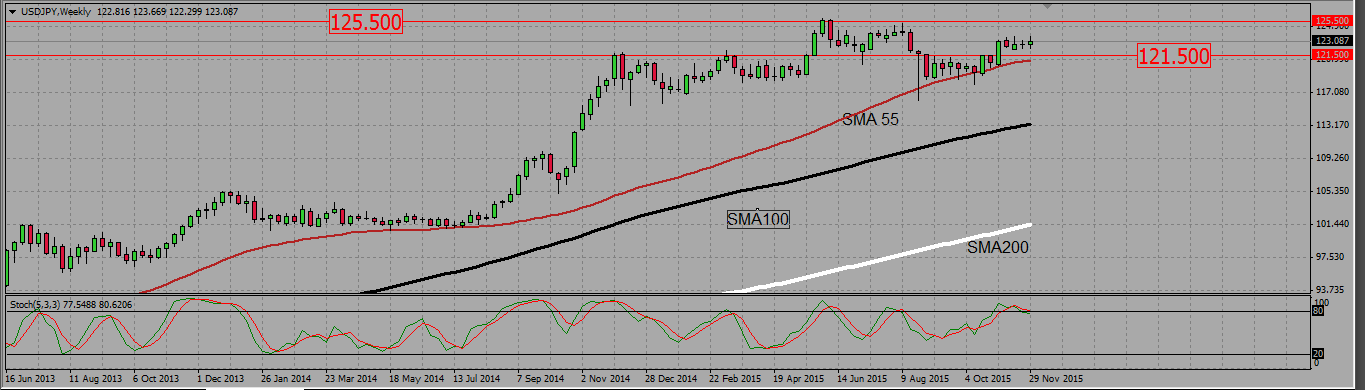
On the weekly chart, both 100 and 200 SMAs are clearly pointing up, indicating a long term bullish trend. We see two supports : an horizontal line at 121,5 , and the 55 SMA. as long as the pair trades above those supports, I will only buy signals on that pair.
USDJPY WEEKLY CHART.
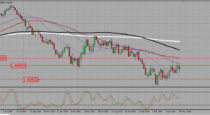
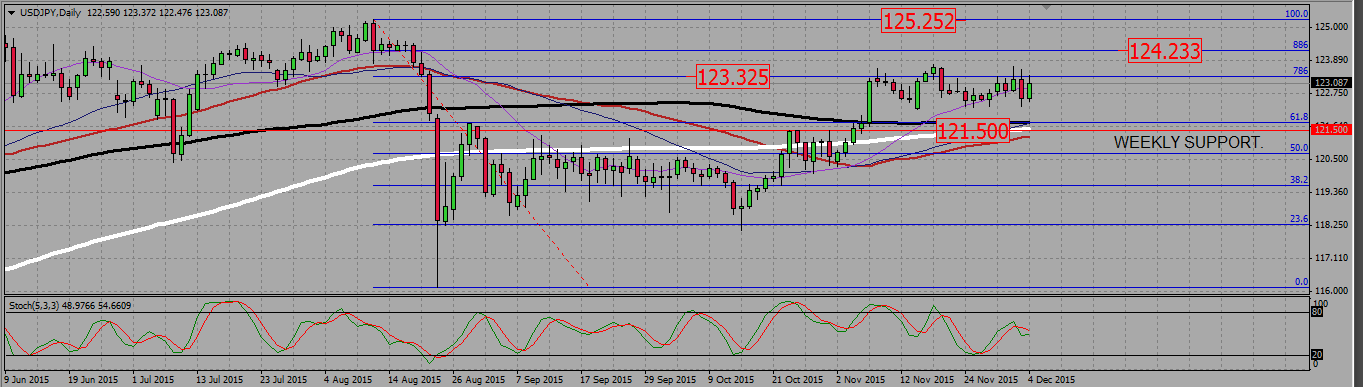
Finally, the daily chart. shows the pair struggling under a 0,786 fib resistance around 123,25. Above that level, the 0,886 line is at 124,25, and the 100 (former high) is at 125,25. I will watch those three levels to eventually take my profits there. Those lines, if broken up, may also be used as supports to find long trades.
USDJPY DAILY CHART.
 (2 votes, average: 5.00 out of 5)