
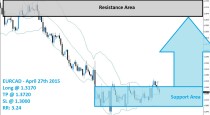
Buy signals above 1,265, aiming at 1,46 and above.
The loonie usually goes up when oil prices go down, and this is basically what they should do after the UK decision to leave the EU.
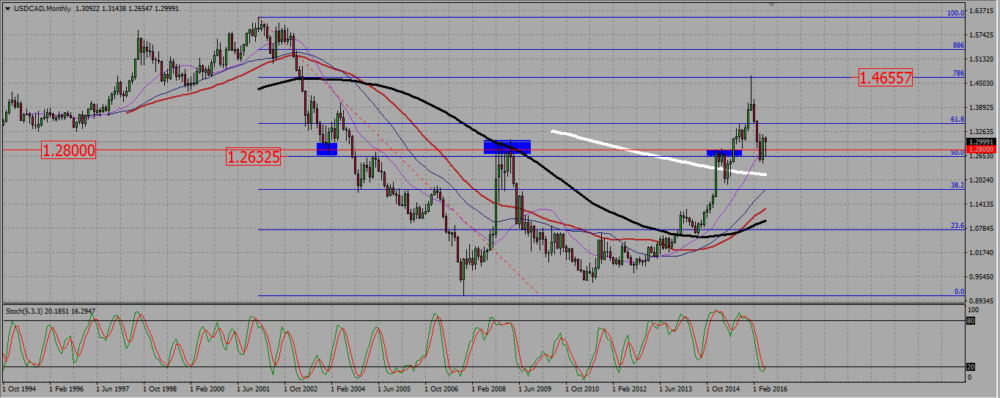
On the monthly chart the pair just rejected a 50 Fib line support near 1,263. the May candle was a bullish engulfing one. On that chart, the pair also started a higher-lows higher-highs cycle, typical for an uptrend.
USDCAD MONTHLY CHART.
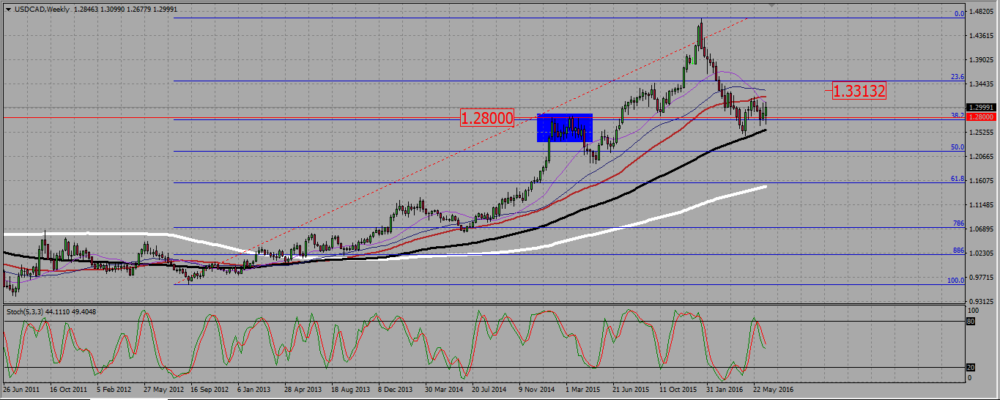
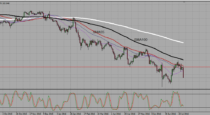
On the weekly forex chart the pair is in an uptrend, even if the last bearish consolidation was a little bit deeper than expected. The loonie is supported by the 100 SMA and has just rejected a support zone under 1,28 (blue box). As long as it remains above the 100 SMA, the main trend is up.
USDCAD WEEKLY CHART.
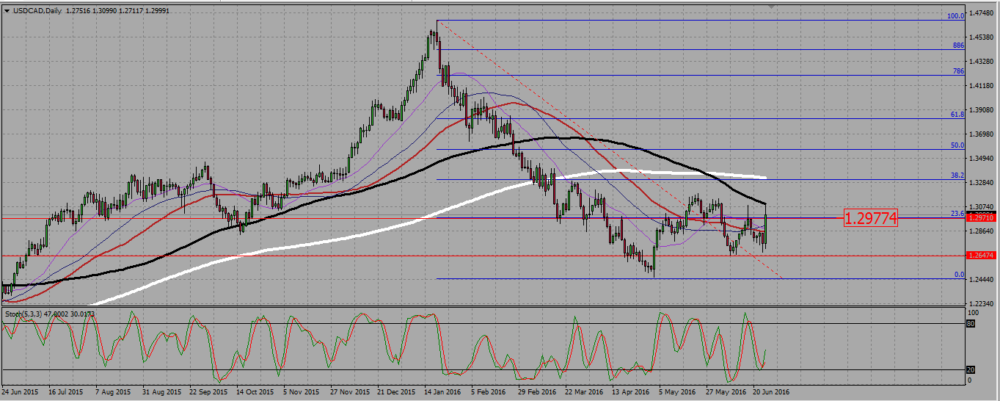
On the daily we see that strong bearish consolidation, and the pair bouncing from its low at 1,245, then breaking up a resistance at 1,265 that now stands support. The area around 1,30 1,2975, with the 23,6 Fib line of the bearish consolidation stands now resistance.
Friday candle is a bullish engulfing one. Combined with the bullishness of the monthly chart and the fundamentals factors (see our NEWS CALENDAR indicator ), it makes more sense to look for buying signals above the 1,265 support, than to sell a rejection of the resistance at 1,30. This is why I prefer to buy the usdcad for the moment.
USDCAD DAILY CHART.
 (1 votes, average: 5.00 out of 5)

Add your review