
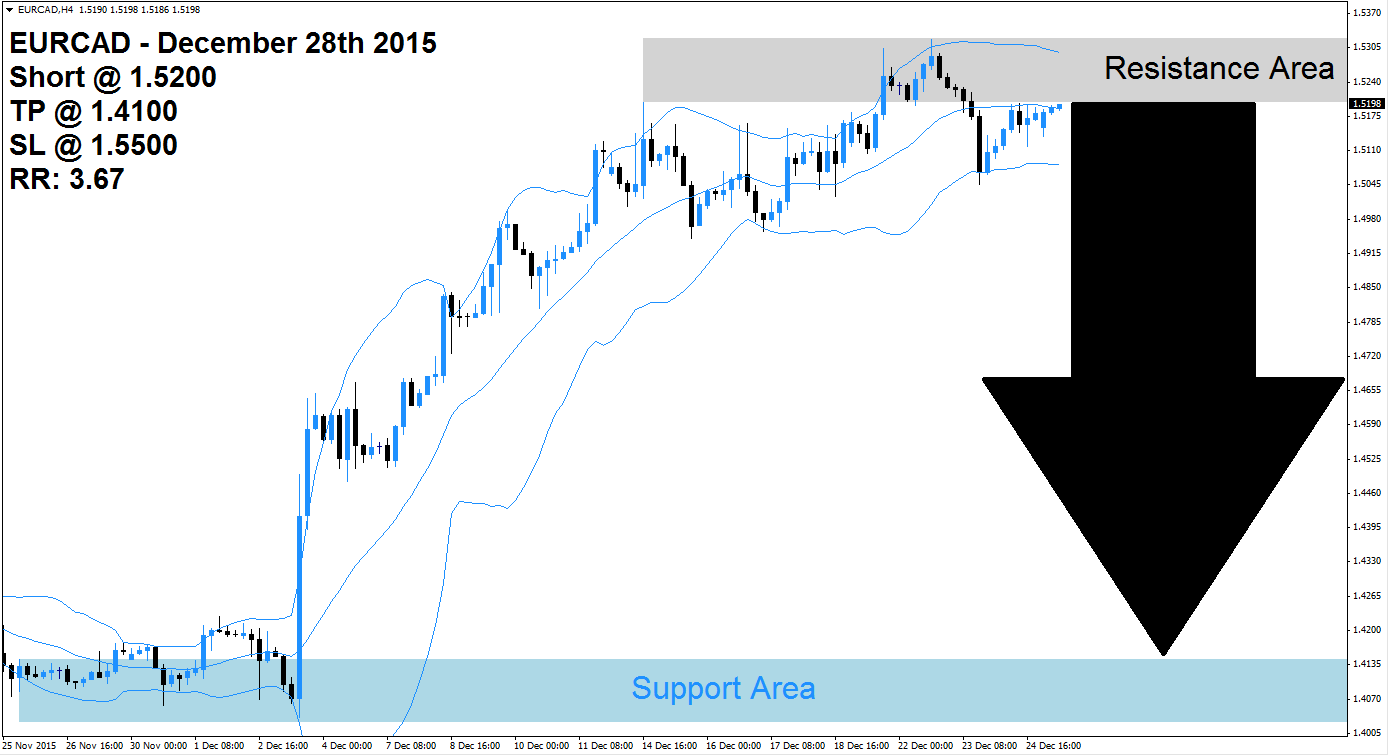
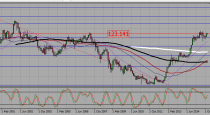
The EUR vs CAD lost steam which propelled this currency pair from its support area, marked in light blue in the above H4 chart, into its resistance area visible in light grey. The Bollinger Band indicator confirmed the strong rally, but is now suggesting the end of the move and favors a sideways trend. All three Bollinger Bands are trending sideways with the upper band trading inside of its resistance area and the middle band as well as lower band trading below it.
The end of the rally could invite forex traders to realize floating trading profits by closing existing long positions. The EURCAD is trading between the middle band and the upper band of the Bollinger Band indicator and a breakdown below the middle band will additionally result into new net short positions. The expected profit taking sell-off could take this currency pair all the way down into its support area for a full retracement, but a 50% move from its peak is more likely.
Forex traders are advised to enter short positions at 1.5200 and above in order to be well position for the expected profit taking sell-off in this currency pair and a breakdown in price action. Conservative forex traders are advised to wait for the breakdown below the middle Bollinger Band which will increase selling pressure in this currency pair. A take profit target of 1.4100 has been selected for a potential trading profit of 1,100 pips.
Forex traders should protect this trade with a stop loss level at 1.5500 for a potential trading loss of 300 pips which will result in a Risk-Reward (RR) ratio of 3.67.
EURCAD
Short @ 1.5200
TP @ 1.4100
SL @ 1.5500
RR: 3.67
 (1 votes, average: 5.00 out of 5)
Add your review