
Subscribe to updates (PA analysis by Shehab) via email – It’s FREE 😉
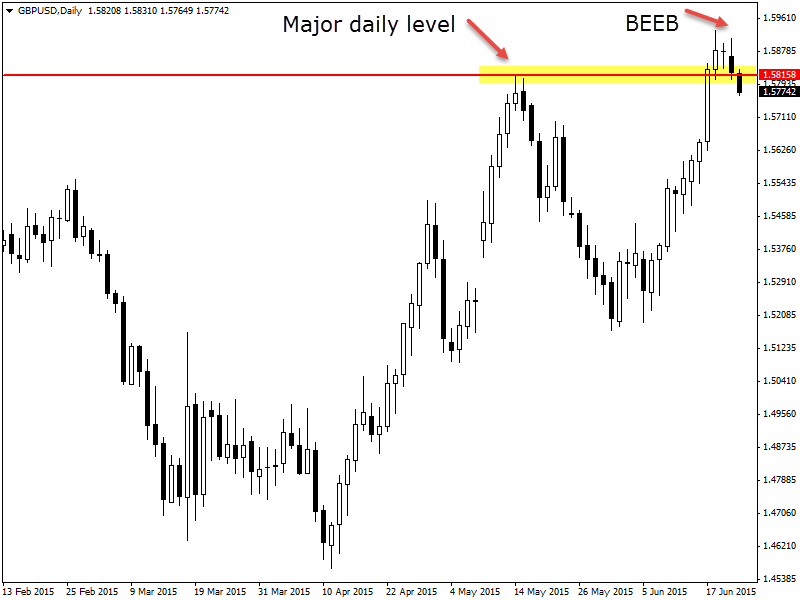
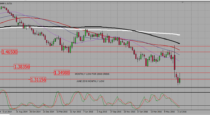
The GBPUSD has fired off a BEEB (what is BEEB?) on the daily chart that has send price collapsing through a important daily support level.
If you zoom your chart out on the daily time frame you will see that this is quite a significant level and that prie moving below with this BEEB is quite important.
Now that price is below this major support level we can watch the price action behavior to make sure it is not a false break and to start to look for short trades. If price does rotate back into the old support and potential new resistance area it could be high probability area to hunt for a potential short setup such as a false break at the new resistance which would once again get the market thinking price is looking to bust out back higher before it snaps back lower.
Daily Chart
 (No Ratings Yet)
Add your review