TABLE OF CONTENTS:
The Quasimodo Pattern or Over and Under pattern is a relatively new entrant to the field of technical analysis in the financial markets. Although new, the Quasimodo pattern is a commonly occurring theme that is more frequent when price carves a top or a bottom or when price begins a major correction to the trend.
The Quasimodo Pattern, although complex as it might seem is actually very simple. This trading pattern is especially powerful because when it occurs, in most cases, traders will notice a confluence with other methods of analysis.
For example, when a trader spots a Quasimodo pattern near a support or resistance level, it increases the confidence of the trader or the trading probability. Likewise, when trading divergences, when you spot a Quasimodo pattern, that confluence can be used to trade the divergence set up with more confidence.
As we can see from the above, the Quasimodo pattern is not a trading strategy by itself but is more of a confluence pattern that can be used to confirm a trader’s bias. Of course, the Quasimodo pattern doesn’t appear all the time, but when it does, traders can be sure that the market offers a high probability trade set up.
A Quasimodo Pattern is simply a series of Highs/Lows and Higher or Lower highs or lows.
Quasimodo Short Signal Pattern
The fifth level in the set up is the trigger, where a short position is taken. Stops are set above the higher high and the take profit level is up to the trader.
Quasimodo Long Signal Pattern
The fifth leg in this pattern is the trigger for long positions with stops set to at or below the lower low
Quasimodo Long Signal Pattern Examples:
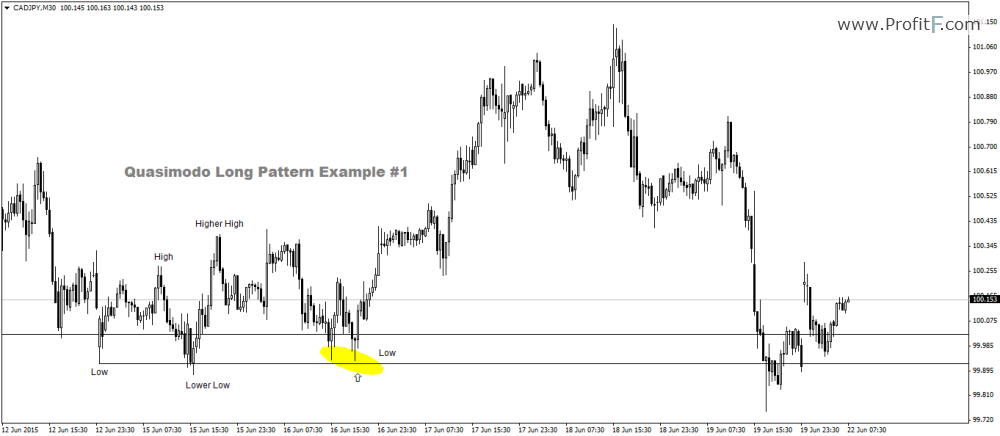
Quasimodo Long Example #1
Here is another example of the Quasimodo Long example:

Quasimodo Long Example #2
Quasimodo Short Signal Pattern Examples:
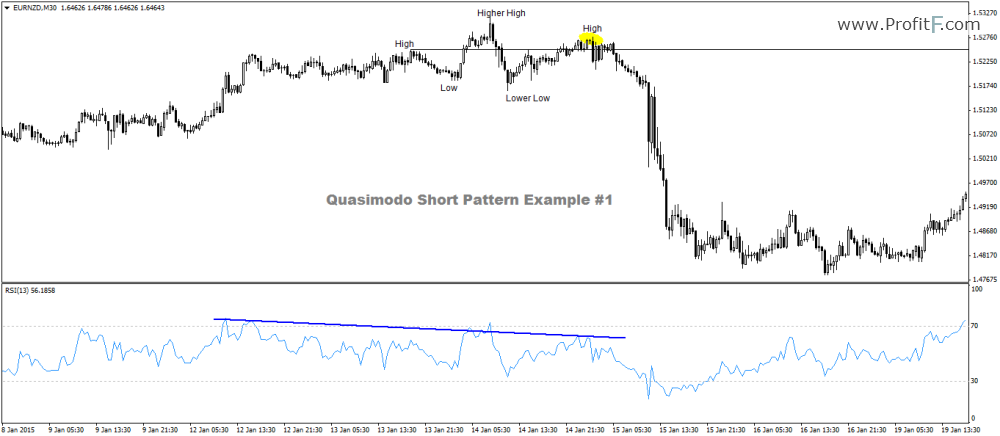
Quasimodo Short Example #1
Another example of the Quasimodo Short pattern example is given below: 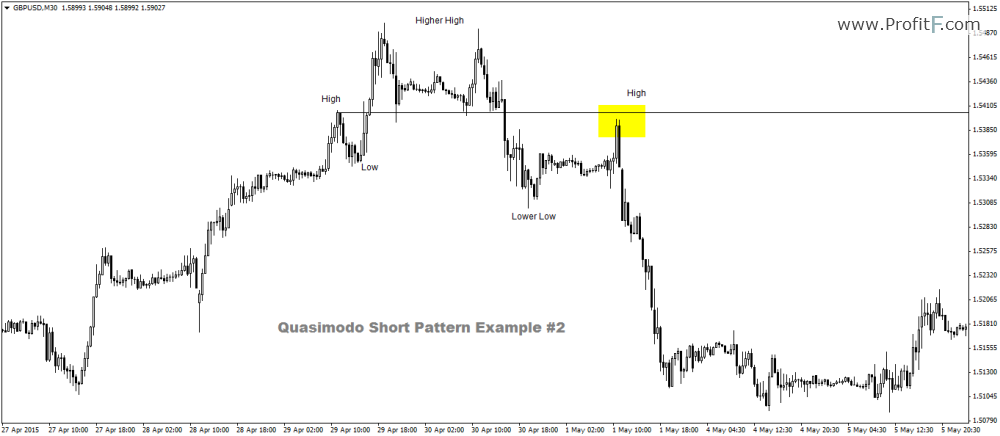
Quasimodo Short Example #2
As we can see from the above, the Quasimodo or Over and Under pattern is a relatively simple pattern, which when used in conjunction with other trading strategies or signals offers a great way to increase the probability of a trade set up.

 (51 votes, average: 4.35 out of 5)