
The Ultimate oscillator indicator compares the smoothed price relative to the price of the look back period. The Ultimate oscillator was developed by Larry Williams in 1976 in the Technical Analysis of Stocks and Commodities magazine.

The Ultimate oscillator is designed to measure momentum which is captured across three different time frames. The Ultimate oscillator was designed to overcome a common flaw with most momentum oscillators, which usually peaks at the start of a trend and then beings to form divergences as price continues. By attempting to capture momentum across different time frames, the Ultimate oscillator tends to address these flaws.
The Ultimate Oscillator comes with a bit of complicated calculations where in it defines the variables as follows:
And finally derives at the Ultimate Oscillator’s calculation which is 100 x [(4 x Average 7) + (2 x Average 14) + Average 28]/(4+2+1)
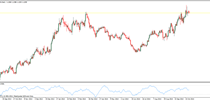
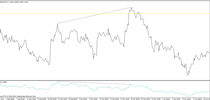
The Ultimate Oscillator can be traded based on spotting divergences and a crossover of the 50 line. Buy and sell signals are also triggered when price declines from 80 or 20 levels.
Download Ultimate oscillator indicator

 (1 votes, average: 4.00 out of 5)
Add your review