AUDUSD TRADING PLAN
Watch retest of 0,76 as a support. Buy signals towards 0,787, sell signals towards 0,735.
On the monthly chart the pair rejected a Fibonacci support level around 0,70, and rose by 600 pips to meet a strong resistance level around 0,76.
AUDUSD MONTHLY CHART.

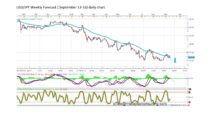
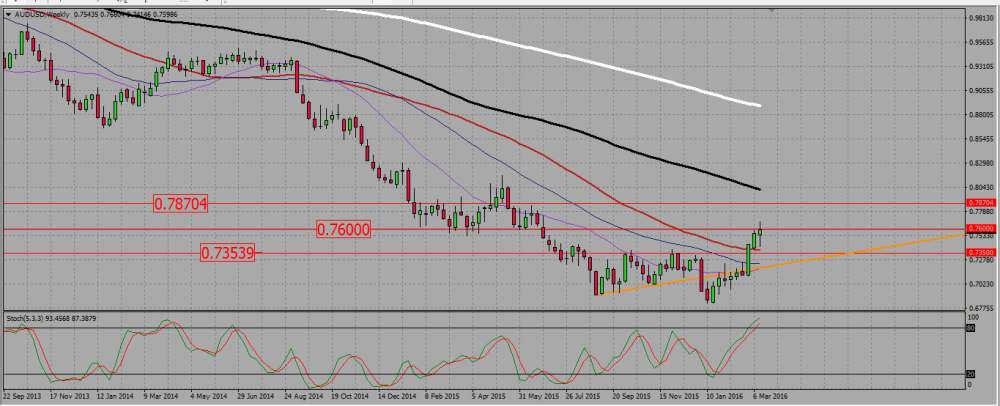
On the weekly chart the pair completed an inversed head and shoulders. There is an obvious support line around 0,735. That level should be our target should the pair rejected the 0,76 resistance. On the other side, a resistance is located near 0,787 will be our take profit level on a bullish break out of 0,76.
AUDUSD WEEKLY CHART.
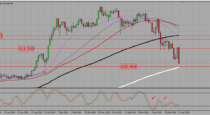
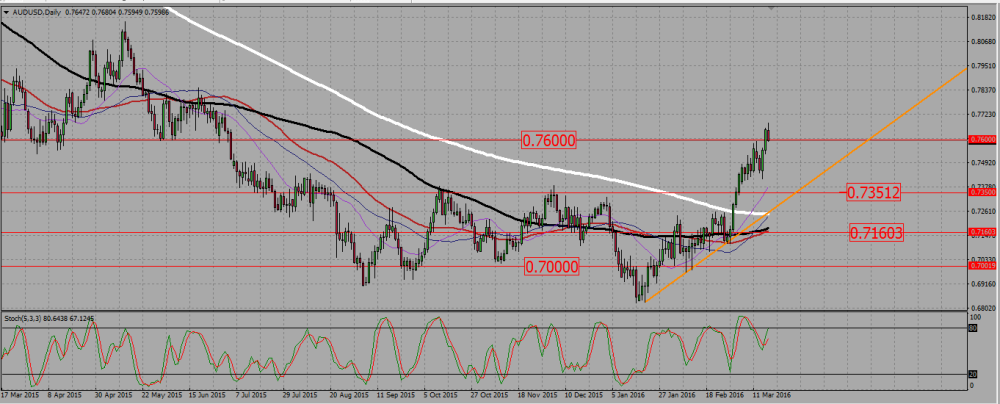
The daily chart shows a mixed -no trend- situation, with the aussie bullishly breaking the 0,76 resistance on Thursday, to come back to retest it as a support on Friday. The pair ended the week at that level.
AUDUSD DAILY CHART.
 (No Ratings Yet)