
Subscribe to updates (PA analysis by Shehab) via email – It’s FREE 😉
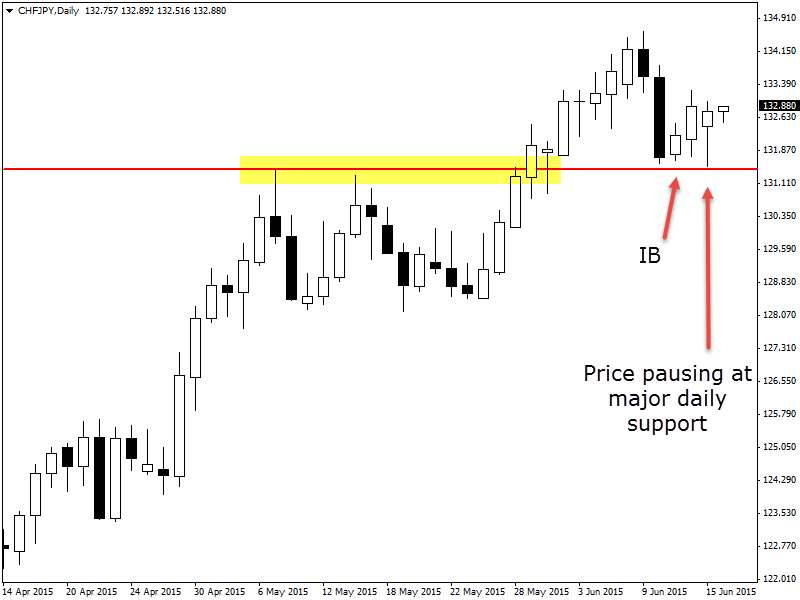
Price is in a nice stepping up-trend in this market with higher highs and higher lows. Price has just recently pulled back into the daily support level as my daily chart below shows and has now paused.
This is a super common pattern or market rule and something that I talk about in here a lot for you. Price in trends cannot move either straight higher or lower forever. Obviously those traders who make large profits out of the moves higher or lower want to cash in those profits and the only way to do that is to close their trades and this makes the market rotate.
For example; if you bought Forex pair XYZ at the low and you then made a lot of money from the trend higher, you would want to cash out of your profits. You may be worried the trend is going to end and price turn around or you may just want your profits. When this starts happening all of a sudden instead of there being a heck of a lot of buyers/bulls all trying to buy into a trend higher, all of a sudden there are sellers getting out. This is why the market paused and goes sideways or this is also why you get retracements within the trend.
Once all those sellers have been shaken out of the market place, the trend will continue. Why will the trend continue after the pause or quick retrace? Because the underlying reason for the trend is still in place – nothing has changed at all.
If we look at the CHFJPY daily chart we can see a strong move higher a retrace and now a pause. If price can now move higher and break to make a new higher high it is likely we will see a strong push higher again.
 (No Ratings Yet)
Add your review