
Subscribe to updates (Weekly FX analysis by Stephane L) via email – It’s FREE 😉
1-EURUSD TRADING PLAN.
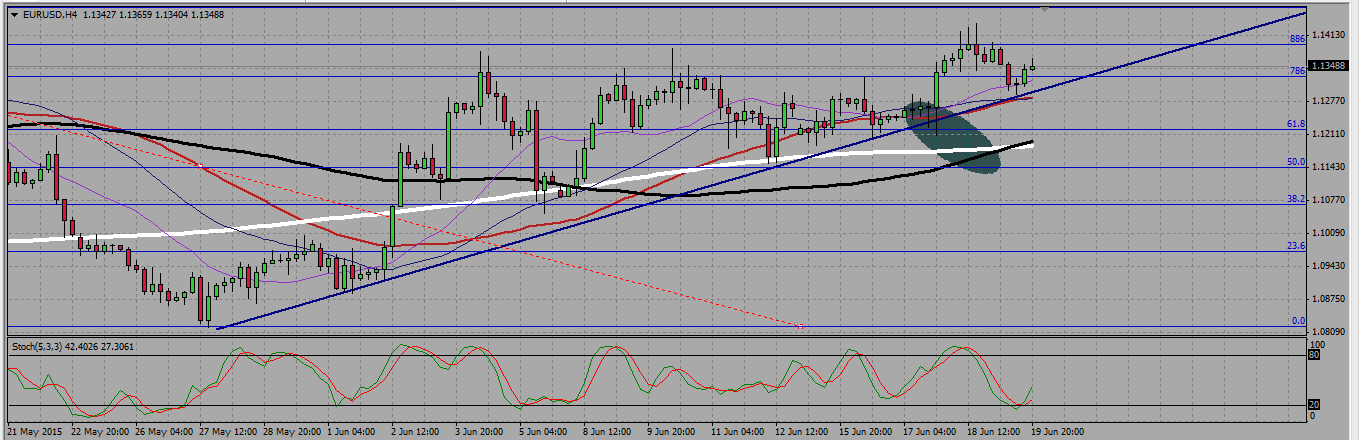
Be very careful with the euro this week, for nobody really knows what will happen to Greece, nor how the markets will react in cas of a grexit. I will cautiously monitor a support trendline on H4, to enter long on a rejection, or short on a bearish break out of it. Another option is just to stay flat with the euro untill we know what happens with Greece.
On the daily chart we see the pair being in a consolidation mode, with a shooting star candle rejecting a 886 fib resistance level around 1,14, and then a doji. We see a clear support trend line.
EURUSD DAILY CHART.
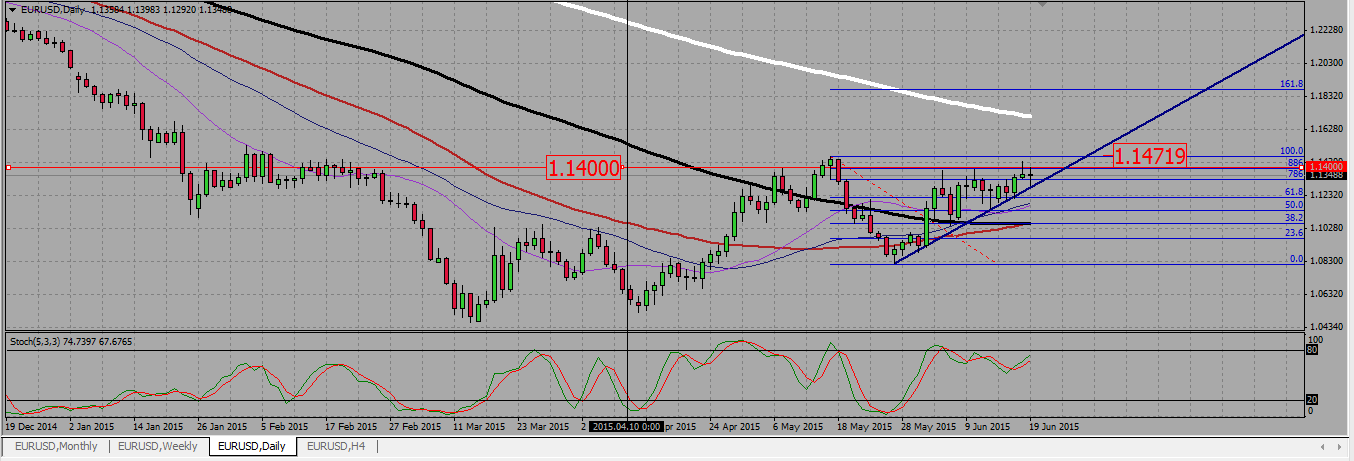
If the EURUSD opens under 1,14 on Monday, we may expect to start the week with a bearish consolidation. In such a case I will monitor the pair reaction near the support trend line, looking for a bullish rejection, or a bearish breakout. I will trade lightly, for that strategy might have given one bad signal last week (see chart).
EURUSD H4 CHART.
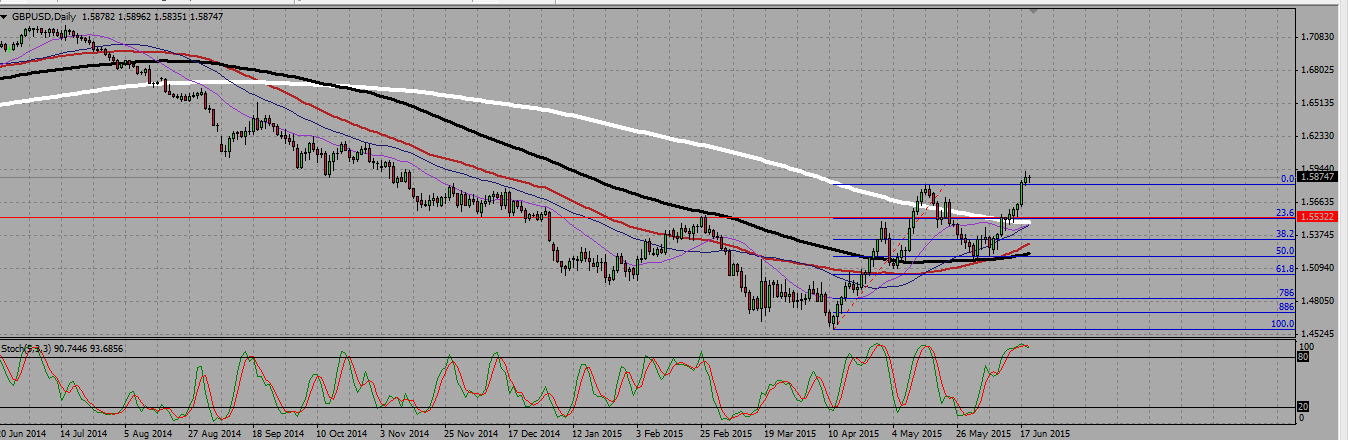
2-GBPUSD trading plan.
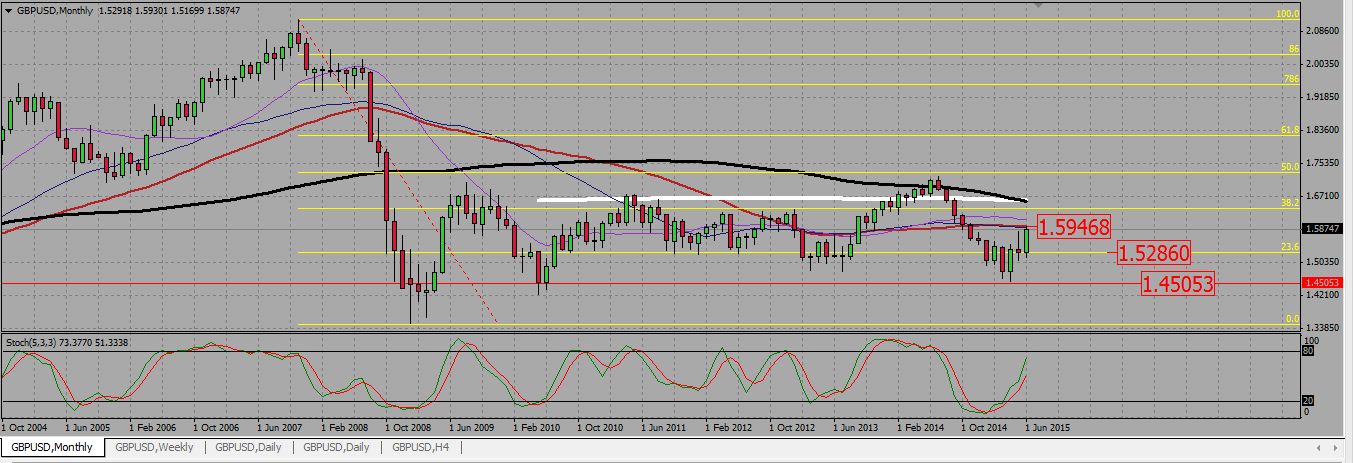
GBPUSD montlhy is rising from a support at 1,45. It broke up a 23,6 fib resistance line at 1,528 and keeps going up, but it is now facing a strong resistance around 1,59, where both the 40 and 55 monthly SMAs are located.
GBPUSD MONTHLY CHART.
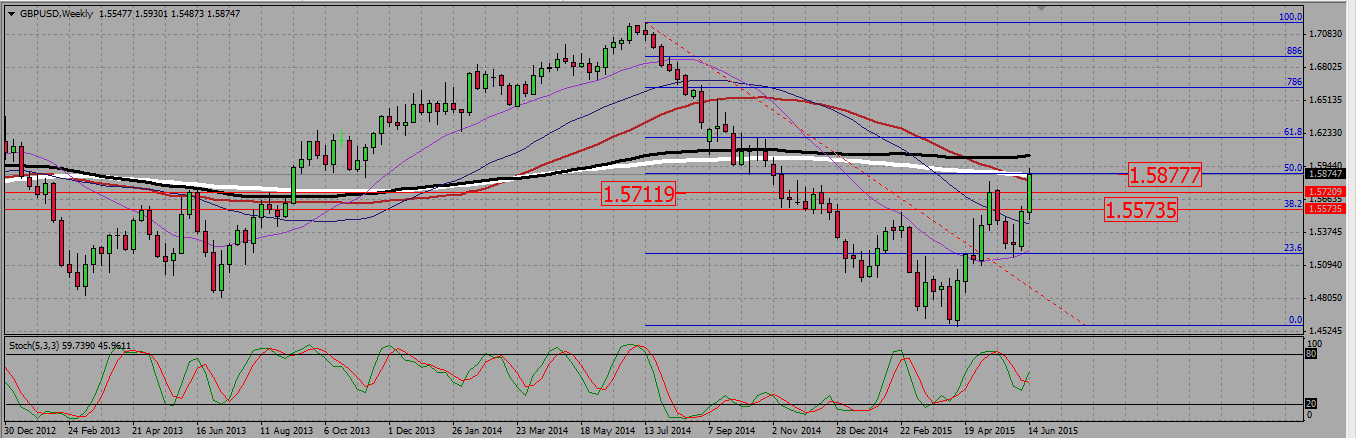
The weekly chart confirms that strong resistance zone around 1,59 with the 200 and 55 weekly SMAs at that level, together with a 50 fib resistance. We see supports around 1,57 and 1,5575, and this is where we should look for longs if the pair will consolidate south.
GBPUSD WEEKLY CHART.
Finally, the daily chart shows us an evening star, followed by a doji, meaning a bearish consolidation is still possible on the beginning of the week. We also see a support around 1,5530.
GBPUSD DAILY CHART.
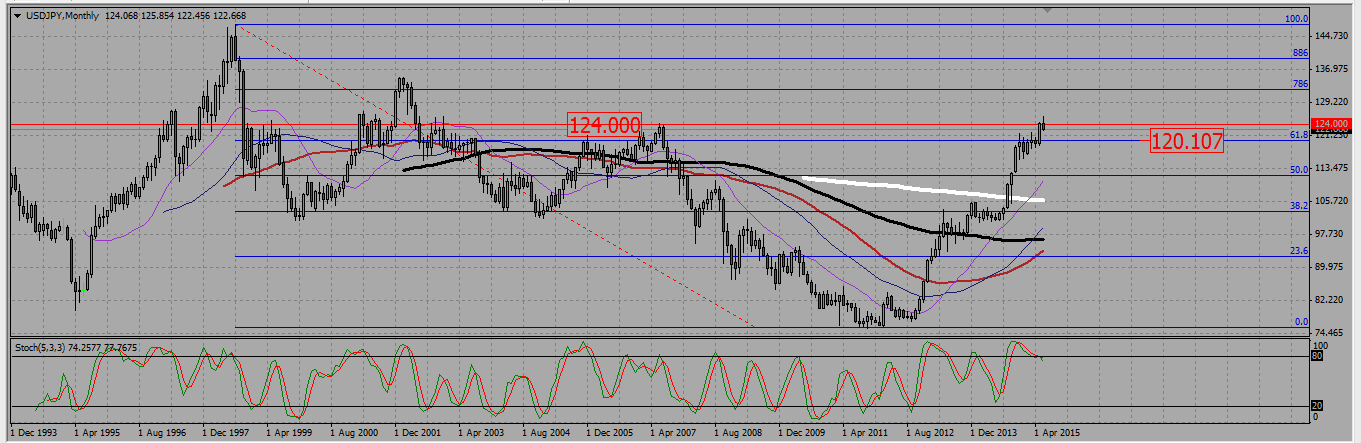
3-USDJPY TRADING PLAN.
The pair is probably going down to 120, but there is a potential double bottom around 122,5 and we may consolidate back to 123,2 123,7 or even 124,25 before turning back.
On the monthly chart, we see the pair rejecting a former monthly high around 124. The next monthly support on the way down is 120 (61,87 monthly fib line).
USDJPY MONTHLY CHART.
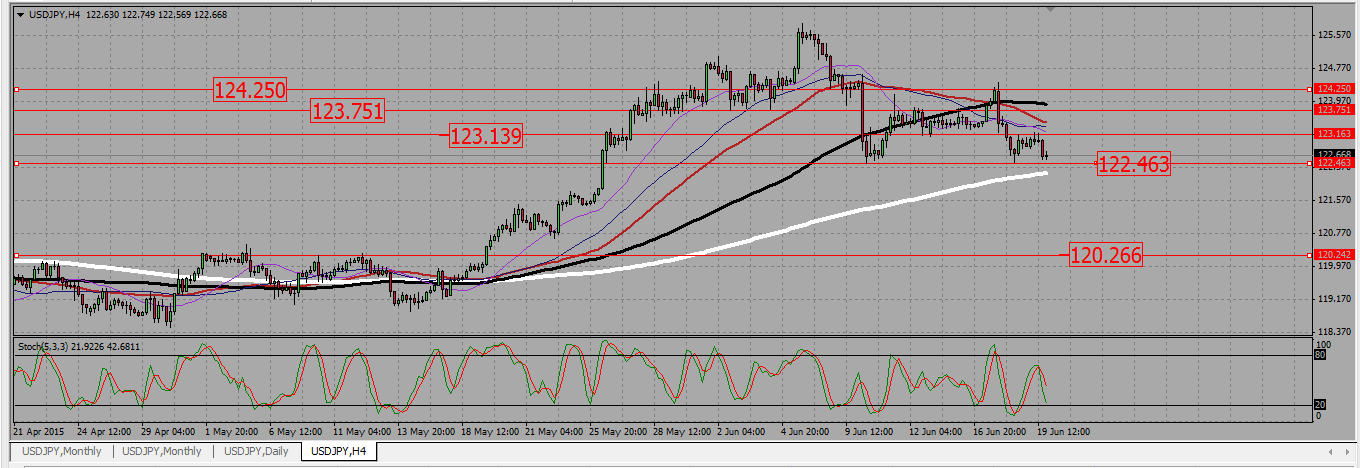
On the H4 we had a bullish trend, then we consolidated for some time, to finally make a lower high around 124,25. We did not however made a lower low, as 122,5 seems to be a strong support with a potential double bottom on it. The last H4 candles suggest we are going to retest that support. We should watch that level on Monday, to know if it will break or hold. Should it hold, we will look to sell signals at resistances ( 123,15 and 123,7) and as long as we are under 124,25.
USDJPY H4 CHART.
 (No Ratings Yet)

Traders, we would greatly appreciate if you’ll write a comment about this trading plan