
USDCAD trading plan.
Watch price action around 1,30-1,305. Sell signals towards 1,2825. Buy only very good reversals on supports, aiming for 1,33.
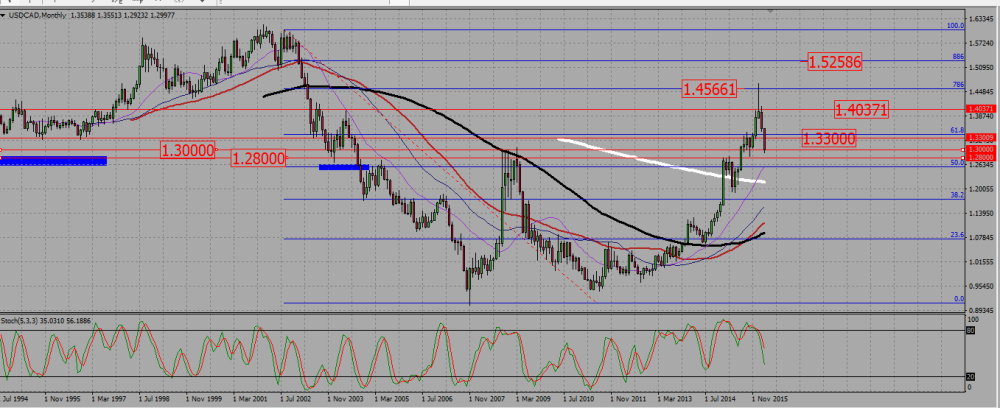
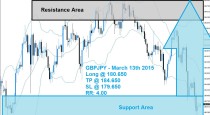
On the monthly chart, the USDCAD keeps on going south, but is now facing a first support around 1,30, and a second around 1,28. That second support will be our take profit level on any short we may enter in.
USDCAD MONTHLY CHART.
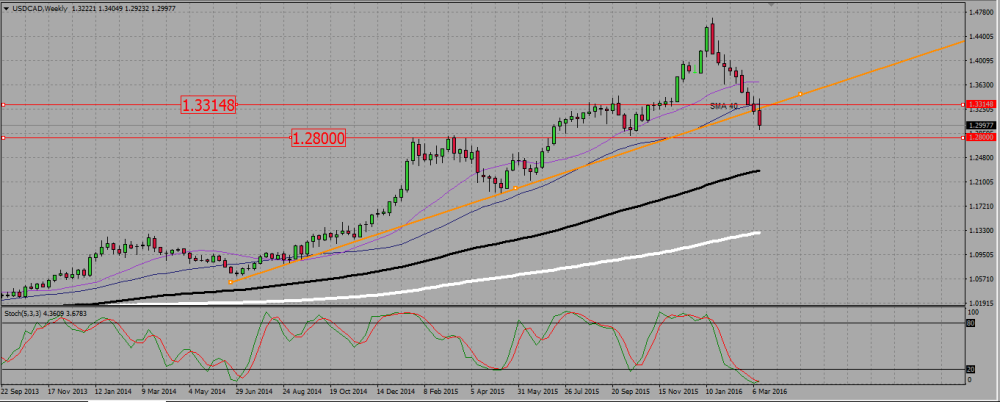
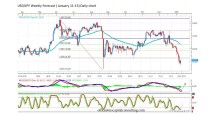
On he weekly chart, he pair is in the sharp bearish consolidation of an uptrend, but the chart also underlines how important a support the 1,28 level is. The loonie also broke own a rising support trend line while consolidating down. That trend line will soon meet the 40 SMA around 1,3315, and the price action shows that place to be resistive. That level seems therefore a good place to set a take profit should we enter long.
USDCAD WEEKLY CHART.
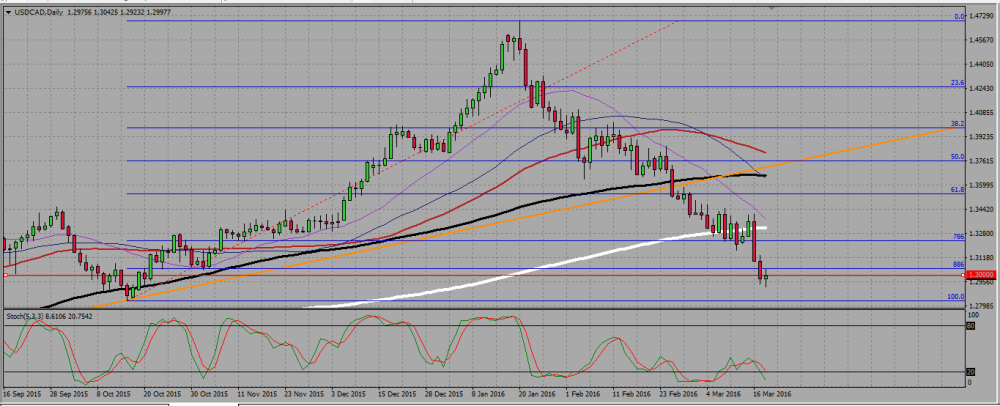
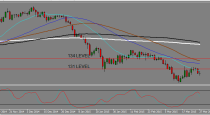
The daily chart allows us to have a closer look on that 1,28 support line, which appears here as a zone between 1,28 and 1,2825. Although the pair is strongly moving south, the last candle is a bullish indecision one, retesting a 0,886 Fibonacci level around 1,305, after having broken that level down.
USDCAD DAILY CHART.
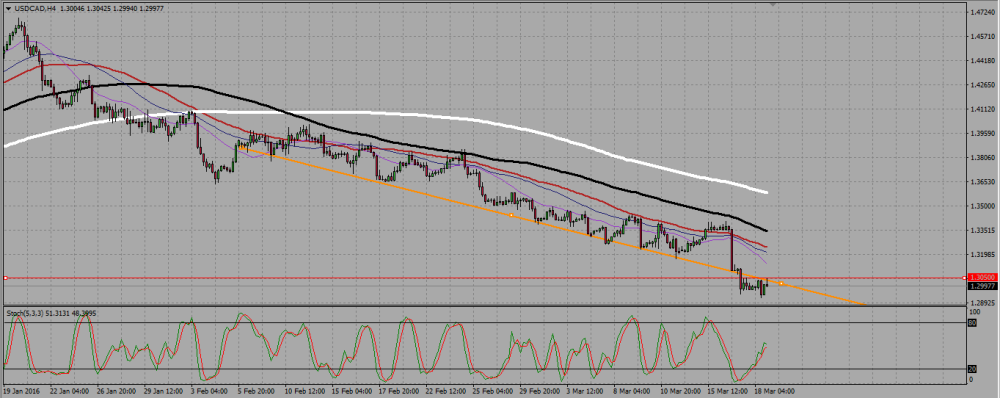
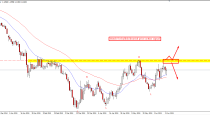
Finally, the H4 chart shows us a perfect bearish trend. CAD even broke down a descending support trend line and is retesting it, ending the week with a bearish pin bar apparently rejecting that trend line. It seems the pair is ready for some more bearish move.
USDCAD H4 CHART.

 (1 votes, average: 4.00 out of 5)
Add your review