Subscribe to Updates (Weekly forex analysis by Stephen L) via Email
EURUSD trading plan.
The pair is retesting a monthly range resistance near 1,14, where it will also meet the weekly 100 SMA. Watch price action there, and buy a confirmed break out or sell a reversal near the daily rising support trend line.
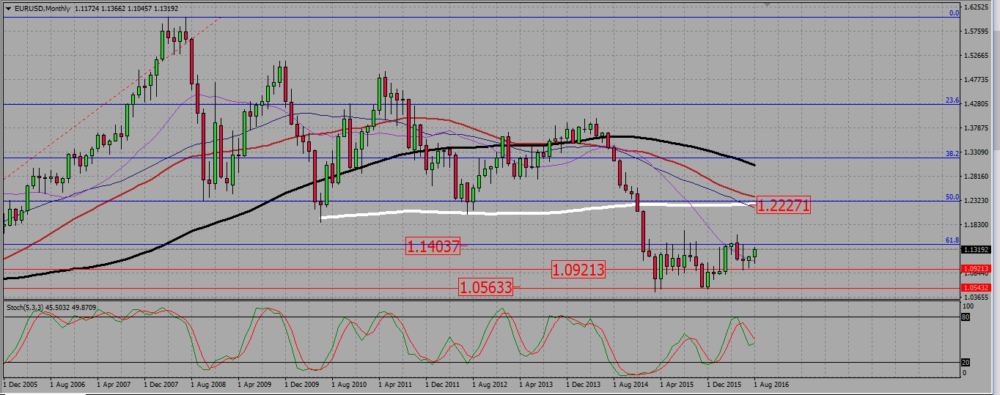
On the monthly chart, the pair seems willing to retest a range resistance near 1,14. There is no clear trend, and the euro has been in a consolidating mode since March 2015. Chances are rather it will reverse down.
EURUSD MONTHLY CHART.

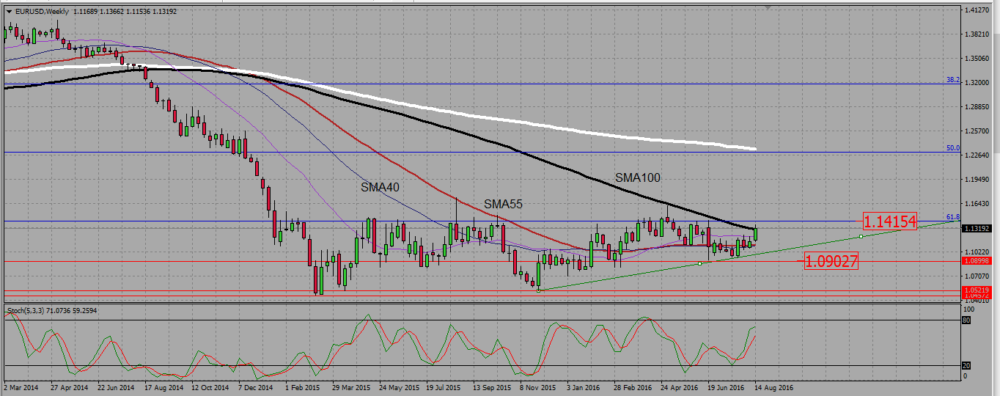
On the weekly chart, the 200 and 100 SMA are pointing down, indicating a downtrend. The pair is moving towards the range resistance near 1,415, and is meeting the 100 SMA as a resistance. In a downtrend situation, the safer is to look for bearish signals there.
EURUSD WEEKLY CHART.

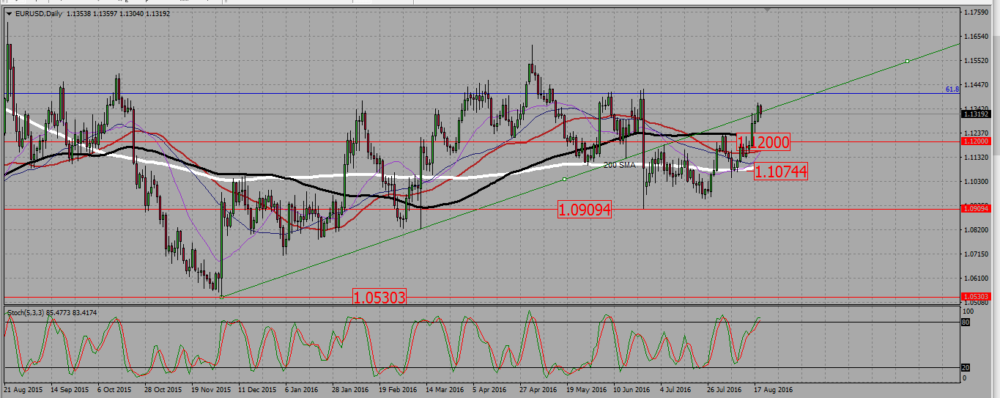
The situation is contrasted on the daily chart. There is no clear trend, and the SMAs are mixed. The pair bottomed around 1,091 on June 24th, and since then started to make lower high. It is now located around a rising support trend line at 1,132, and the last candle is a dark cloud cover, which is not technically a reversal sign, but nonetheless means it is not the time to think long on that pair, all the more as there is long term range resistance between 1,14 and 1,145.
EURUSD DAILY CHART.

Add your review