
GBPUSD trading plan.
Sell signals under 1,525 towards 1,50, 1,475-1,485, 1,475
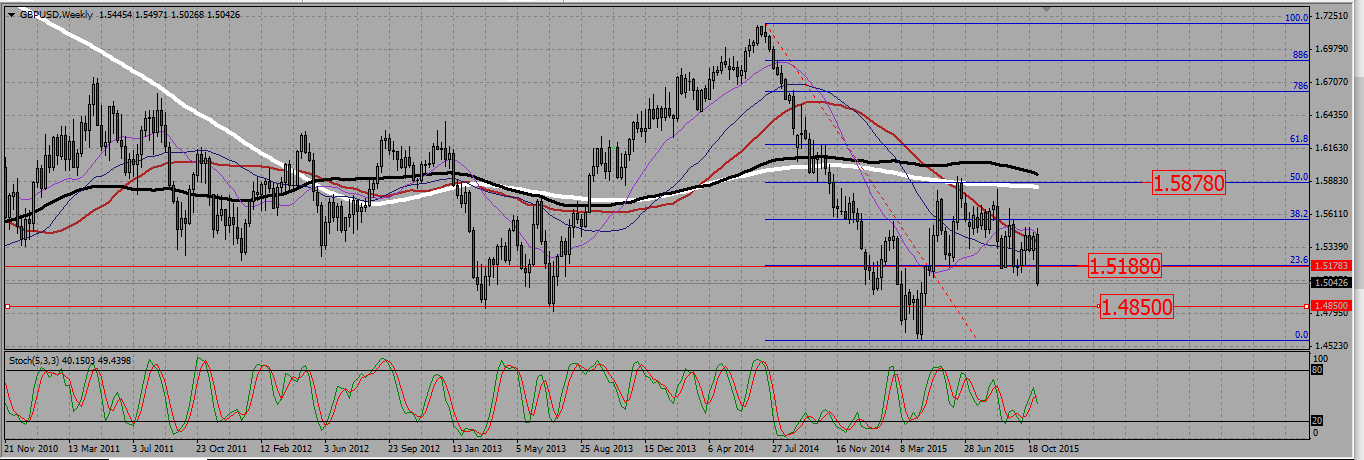
Following last Friday NFP, the cable posted a powerful bearish candle, making a lower low and breaking down a 23,6 Fibonacci support level around 1,519 . I will look to sell that pair, waiting first for some kind of consolidation to a resistance.
GBPUSD WEEKLY CHART.
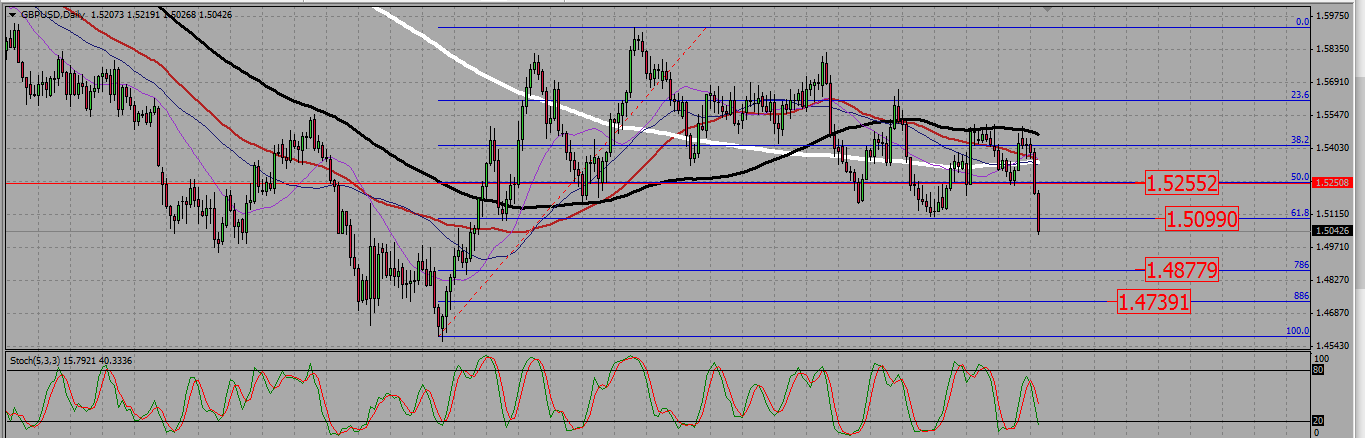
On the daily chart, there is a 50 level Fibonacci retracement around 1,525. The chart shows it to be a strong support/resistance level; this will be my highest resistance point, and I will stop looking for short above it. There is also a 61,8 level that has been broken down near 1,51, being now a resistance level where an short entry may be looked for. On the support side -i.e. potential take profit level-, we see the 0,786 Fibonacci level around 1,4875 and the 0,886 level around 1,48.
GBPUSD DAILY CHART.
USDJPY trading plan.
Look for buying signals above 121,8 (daily 100 SMA) or even above 120. Pay attention to resistances around 123,3, 124,25 AND 125,25, but above them aim for 132.
I will use two monthly charts, with two different Fibonacci retracements here.
On the first chart I will use the retracement from the bearish move that took place between 20007 and 2011. We see the pair nearly took back nearly all of it, confirming a bullish break-up of the 0,886 Fibonacci retracement level at 118,5. I want to be a buyer on USDJPY.
USDJPY MONTHLY CHART (1).

To find a take profit level, I need to look at a broader retracement, namely the bearish move between 1998 and 2011. We see then that the pair is confirming a bullish breaking of a 61,8 level around 120, making that level a very powerful long term support. The first resistance level, which will be my ultimate take profit in the case of a long trade, is the 0,786 Fibonacci retracement located around 132,2.
USDJPY MONTHLY CHART (2)

Before thinking about reaching 132, there are a few short terms resistances lines I will have to be careful of A quick glance at a Fibonacci retracement on the daily chart shows we are just under a 0,786 resistance line around 123,3. The 0,886 level is located at 124,25, and the previous high at 124,25. Those resistances level must be closely monitored on any long positions opened under them, and I will be ready to close any long should I see a reversal signal at one of those levels.
USDJPY DAILY CHART.

 (No Ratings Yet)
Add your review