
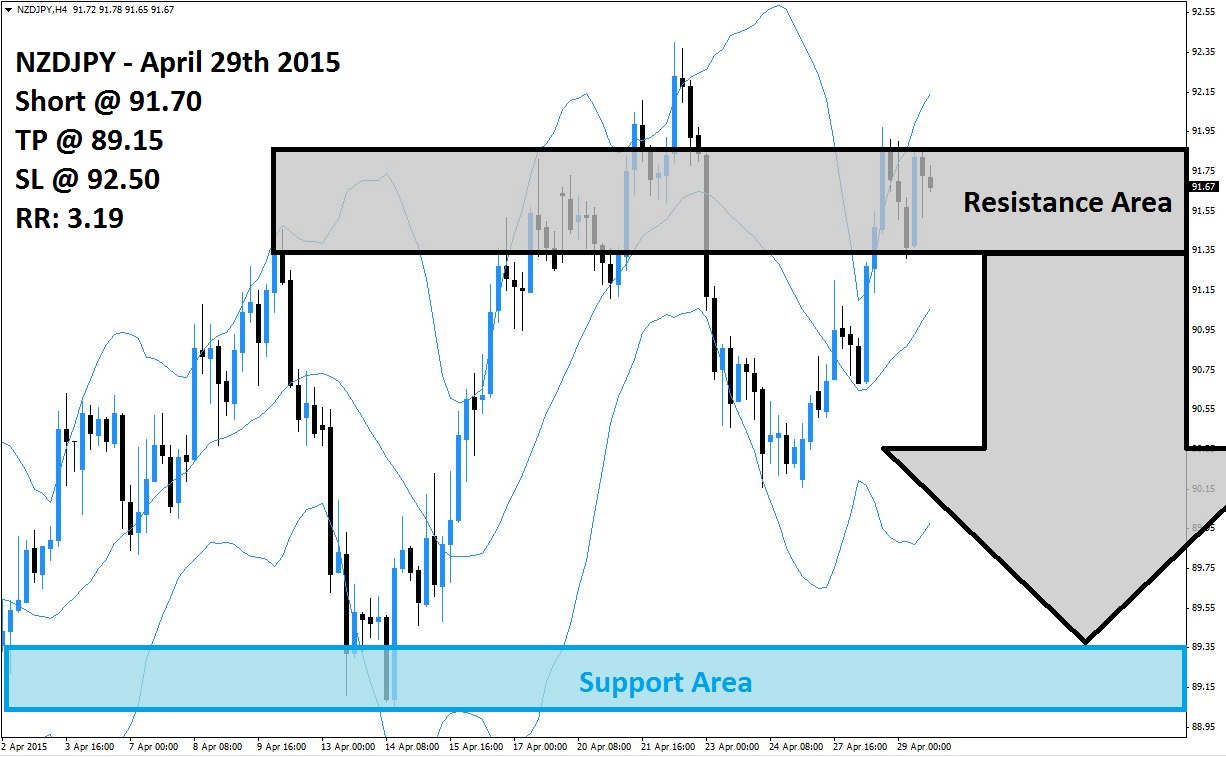
The NZDJPY has lost its upward momentum after a false breakout above its resistance area, visible in light grey in the above H4 chart, was quickly reversed into a breakdown below its resistance area. A minor short-covering rally took this currency pair back inside of its resistance area, but a descending resistance level is currently preventing a further advance. The NZDJPY may have lost enough momentum which will result into another breakdown for this currency pair.
The Bollinger Band Indicator started to diverge with the upper Bollinger Band as well as the middle Bollinger Band sloping higher while the lower Bollinger Band is sloping to the downside. This may give forex traders enough reason to realize floating trading profits and close their short positions in order to lock in recent gains. A breakdown below its resistance area is likely to result into an increase in selling pressure which could take the NZDJPY into its support area, visible in light blue in the above chart.
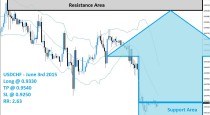
Forex traders are advised to look out for short positions at 91.70 and above. The divergence in the Bollinger Band indicators indicates a potential breakdown and currently there are more bearish factors than bullish factors from both a technical as well as fundamental point of view. A breakdown below the middle Bollinger Band should lead the way to the downside at an accelerated pace. A take profit target of 89.15 has been selected for a potential profit of 255 pips.
Forex traders should protect this trade with a stop loss level at 92.50 for a potential trading loss of 80 pips which will result in a Risk-Reward (RR) ratio of 3.19.
NZDJPY
Short @ 91.70
TP @ 89.15
SL @ 92.50
RR: 3.19
 (No Ratings Yet)
Add your review