
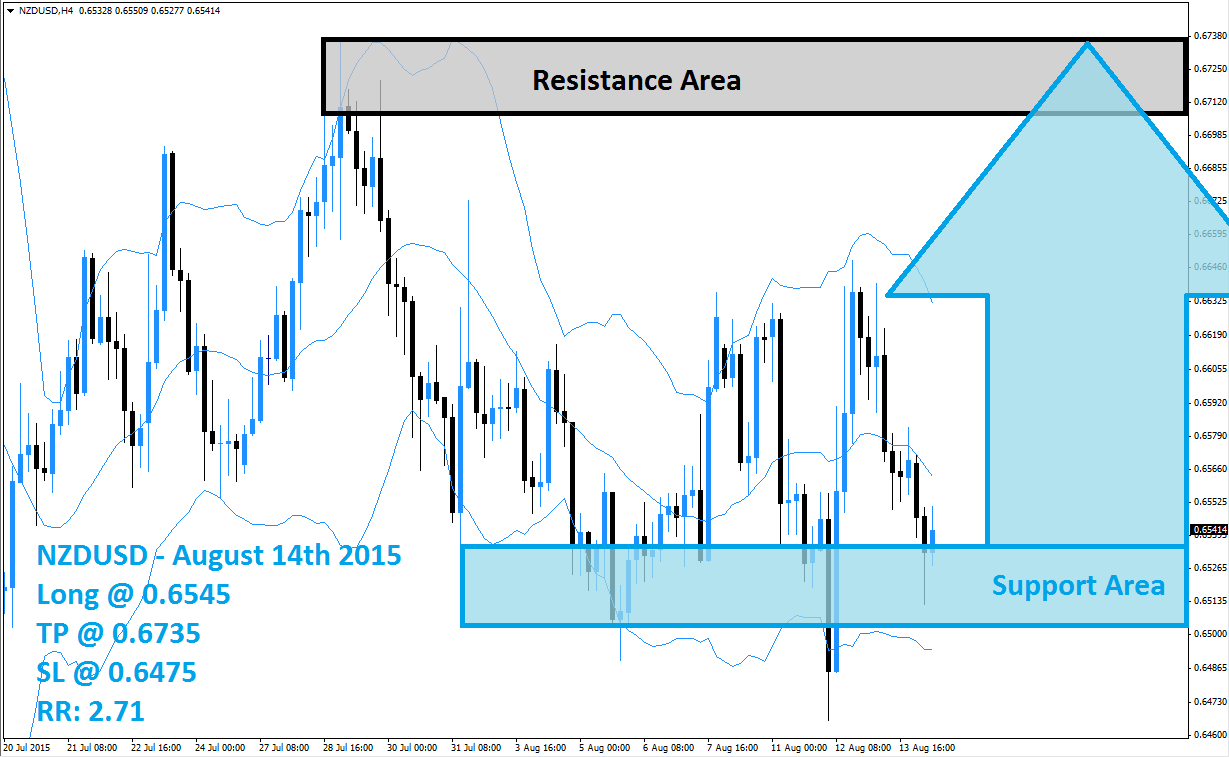
The NZDUSD has entered a sell-off after not being able to breakout above its resistance area which is visible in light grey in the above H4 chart. The upper band of the Bollinger Band indicator was also unable to push above it and the resulting sell-off took the NZDUSD back down into its support area which is marked in light blue. This currency pair tried on three occasions to breakdown below its support area without success and is now.
Forex traders may opt to take the emerging strength of its support area as a good exit point for short positions and realize floating trading profits. This is expected to lead to a profit taking rally fueled by short-covering. A breakout above the middle Bollinger Band will result in a change in momentum and could further increase the rally back into its resistance area. All three Bollinger Bands are currently sloping lower which is expected to change as a result of the short-covering rally.
Forex traders are advised to seek long entry positions at 0.6545 and below this level in order to profit from the expected short-covering rally. Conservative forex traders should wait for a breakout above the middle band of it Bollinger Band indicator before entering their long positions. A take profit target of 0.6735 has been set for a potential trading profit of190 pips on the H4 Chart. More buy orders are expected after this currency pair completes its breakout above the middle Bollinger Band.
Forex traders should protect this trade with a stop loss level at 0.6475 for a potential trading loss of 70 pips which will result in a Risk-Reward (RR) ratio of 2.71.
NZDUSD
Long @ 0.6545
TP @ 0.6735
SL @ 0.6475
RR: 2.71
 (No Ratings Yet)
Add your review