
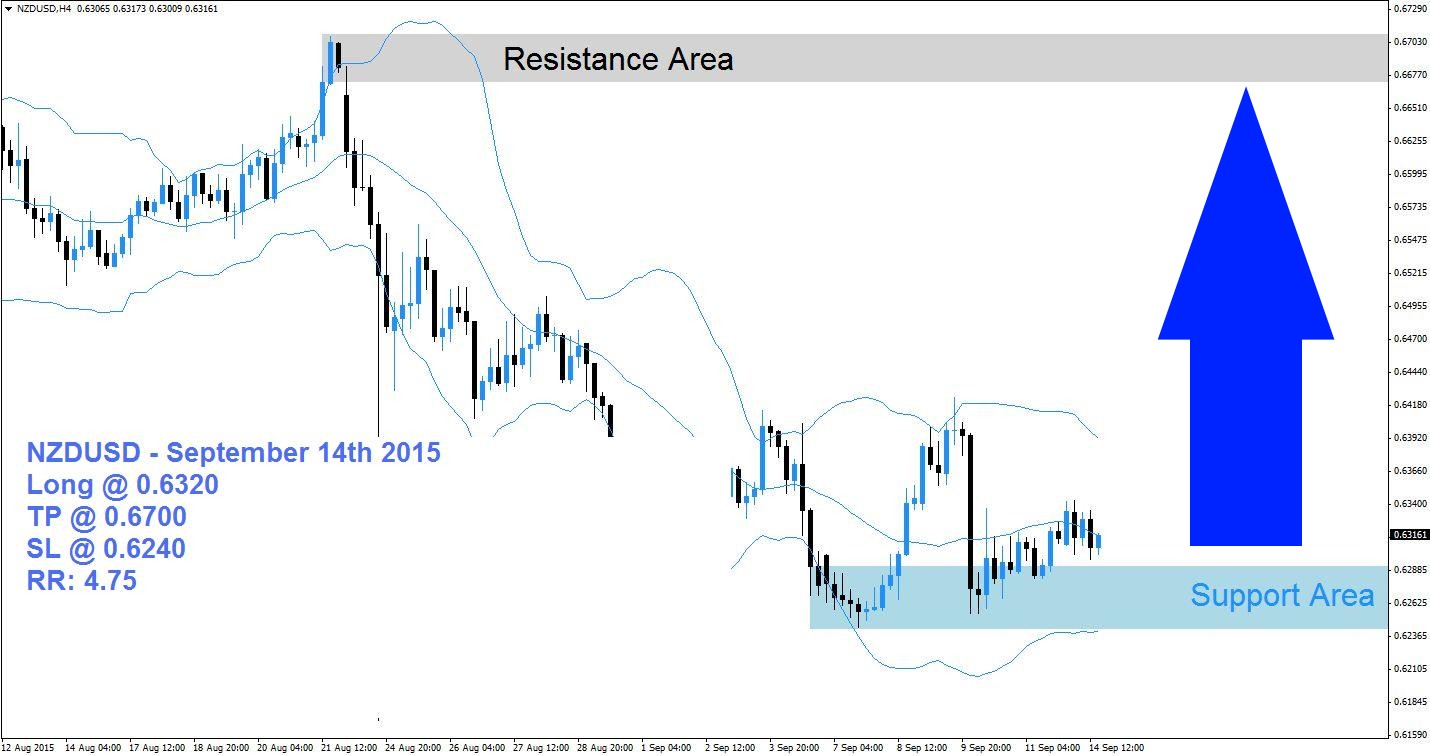
The NZDUSD has entered a sideways trend after ending the sell-off which took this currency pair from its resistance area, marked in light grey in the above H4 chart down into its support area which is visible in light blue. The Bollinger Band indicator confirms the end or pause in the sell-off as the lower band, the middle band and the upper band are all trading sideways as well. The NZDUSD is now poised to enter a rally in order to retrace part of the sell-off.
The more time this currency pair will spend trading sideways the greater the chance will become that forex traders will lock in floating trading profits by exiting their short positions. This will lead to a short-covering rally which can push the NZDUSD above the middle band of its Bollinger Band indicator. The lower band is currently trading below its support area while the middle band and the upper band are trading above the support area.
Forex traders are recommended to enter long positions at 0.6320 and below this level which will position their trading accounts to profit from the expected short-covering rally. Conservative forex traders should wait for a breakout above the middle band of it Bollinger Band indicator before entering their long positions. A take profit target of 0.6700 has been set for a potential trading profit of 380 pips on the H4 Chart. More buy orders are expected after the NZDUSD completes its breakout above the middle Bollinger Band.
Forex traders should protect this trade with a stop loss level at 0.6240 for a potential trading loss of 80 pips which will result in a Risk-Reward (RR) ratio of 4.75.
NZDUSD
Long @ 0.6320
TP @ 0.6700
SL @ 0.6240
RR: 4.75

 (1 votes, average: 2.00 out of 5)
Add your review