
Dear Traders, today we will study a new instrument created on the basis of the Personal Composite Instrument – PCI technology: the currency index &EUR_Index. The following index shows the main European currency variations (EUR) against other segments of the Forex market. For a systematic market indicator we are going to use a portfolio of the most liquid currencies traded against the main European currency: EUR/[USD(4.35%)+JPY(18.2%)+GBP(18.8%)+CHF(19.2%)+AUD(19.8%)+CAD(19.65%)]. The price of each currency is expressed in USD. The weights are determined in accordance with the currency liquidity relative to the volume of international bank circulation. You can get more information and online index chart by clicking here.
The reaction of & EUR_Index to the economic events that take place in Europe is quite stable and the index forms a sustained trend channel, while it is less susceptible to the fundamental events of other currencies. As it was announced during the ECB meeting, which took place on Thursday, the ECB interest rate remained unchanged at 0.05% per annum, deposit rates at -0.2%. This news was announced in spite of the promises to start a prompt QE for the recovery of the EU economy. The ECB announcement made euro lose its value for a short period of time against the most liquid currencies. Though the majority of the economists have predicted the result, the long-term bearish trend has not been formed. Now, &EUR_Index is waiting for new fundamental signals and in spite of the positive US data, it still remains uncertain.
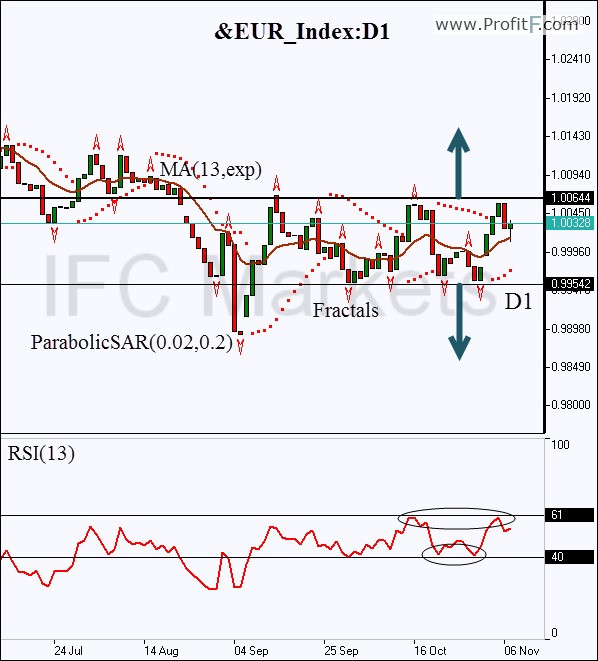
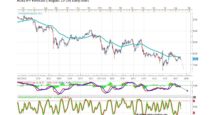
Now let us consider the daily closing/opening price chart of the following instrument created in NetTradeX platform. As we can see the price is moving in sideways, which is confirmed by fractal highs and lows. Based on graphic models “double top” and “double bottom” (marked in black ellipse), the RSI oscillator signal has also formed a channel between 40% and 61%. We will expect a sharp volatility spike after the breakout of any of the channel limits as the fundamental news comes out. That is the main reason that we offer to open two pending orders: Buy and Sell. A pending buy order can be opened above 1.00644, and a Stop Loss order below 0.99542, which is confirmed by 4 Bill Williams’ fractals. A sell order should be placed in the opposite way. Conservative traders are recommended to wait for the oscillator breakout confirmation: it must overcome the local overbought/oversold levels of 40% and 61%.
Having opened a position, the opposite one can be deleted. Stop Loss is to be moved after the ParabolicSAR values, near the next fractal high (sell position) or fractal low (buy position). Thus, we are changing the probable profit/loss ratio to the breakeven point.
See ECB meeting dates here
 (No Ratings Yet)
Add your review