
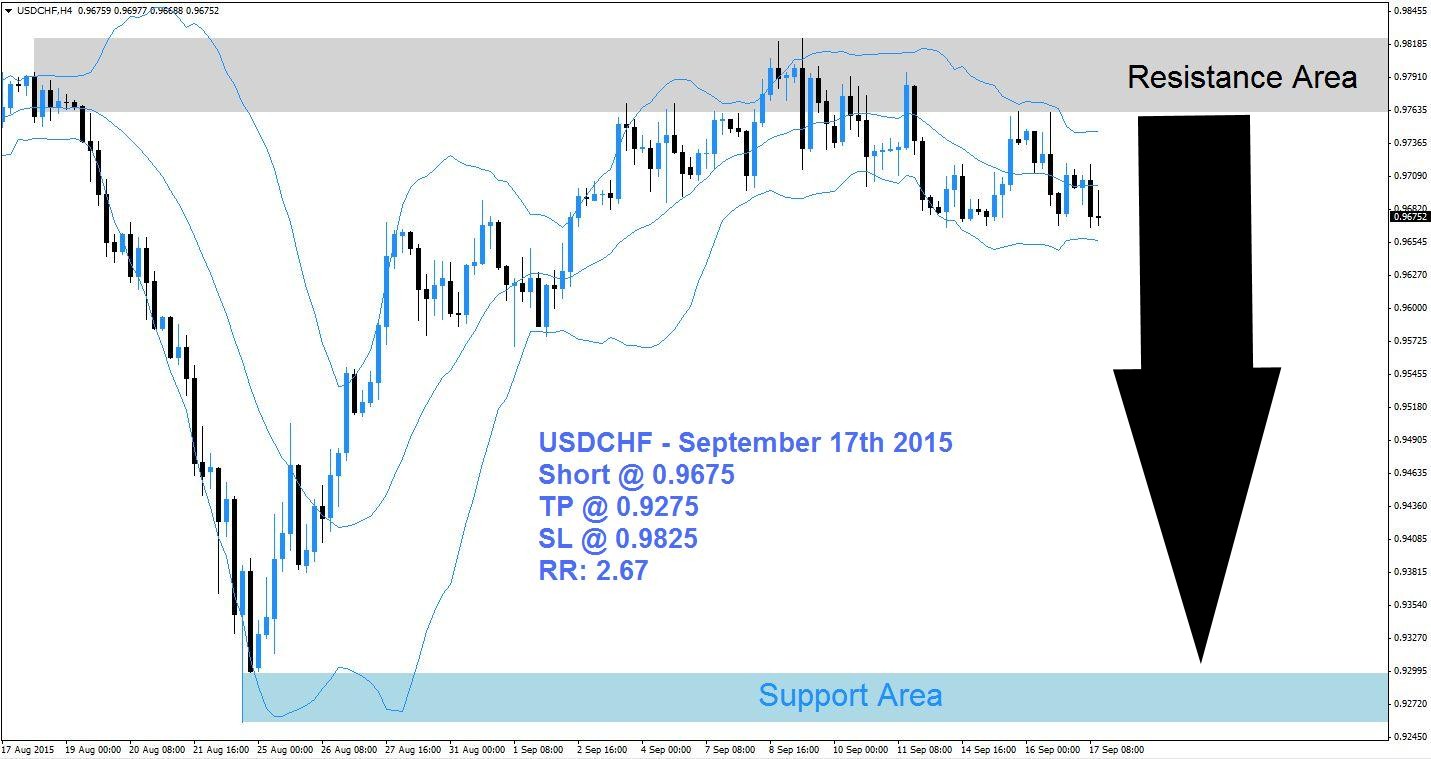
The USDCHF broke down below of its resistance area, marked in light grey in the above H4 chart, following a strong rally. The Bollinger Band indicator has started to move lower after recording its highest point which was located inside of its resistance area. The upper band of the Bollinger Band indicator also broke down and this currency pair is expected to fall victim to a profit taking sell-off over the next few trading sessions.
Forex traders are likely to use the breakdown below its resistance area as a good level to realize floating trading profits after the preceding rally. The USDCHF already broke down below the middle band of the Bollinger Band indicator and is now trading between the lower band and the middle band. A breakdown below the lower band is expected to take this currency pair back down into its support area which is visible in light blue.
Forex traders are advised to enter short positions at 0.9675 and above in order to profit from the expected profit taking sell-off in this currency pair. Conservative forex traders should wait for price action to break down below the lower band of its Bollinger Band Indicator which will increase selling pressure. A take profit target of 0.9275 has been selected for a potential trading profit of 400 pips. More sell-orders are expected below the lower band of the Bollinger Band indicator.
Forex traders should protect this trade with a stop loss level at 0.9825 for a potential trading loss of 150 pips which will result in a Risk-Reward (RR) ratio of 2.67.
USDCHF
Short @ 0.9675
TP @ 0.9275
SL @ 0.9825
RR: 2.67
 (No Ratings Yet)
Add your review