
TABLE OF CONTENTS:
FX Profit Wave – strategy by Nicola Delic. Free system from Scientific Trading Machine (website). System contain 3 MT4 indicators and 1 template file (tpl). every time you see a dot appear on your charts, money is not far behind. The system itself is quick to learn and extremely easy to implement. Even if you are completely new to trading
Download free “FX Profit Wave” >>
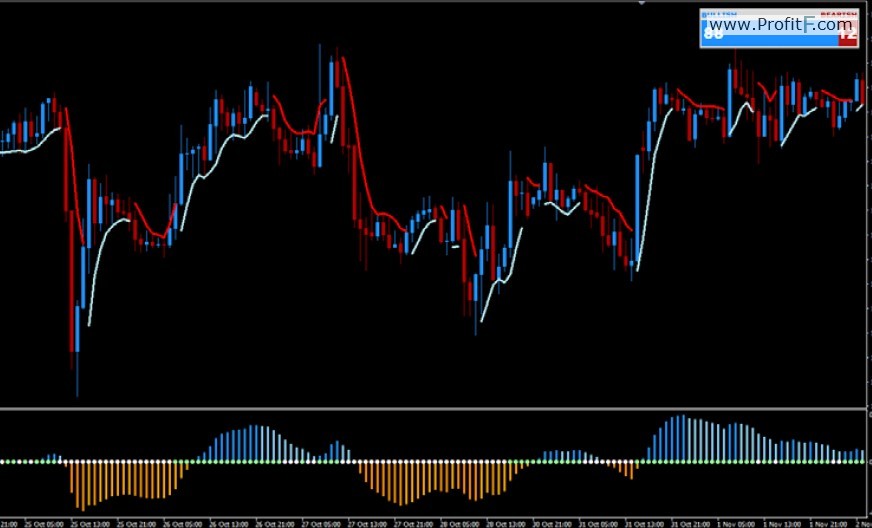
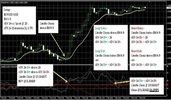
Your MT4 chart with “FX-Profit Wave”:
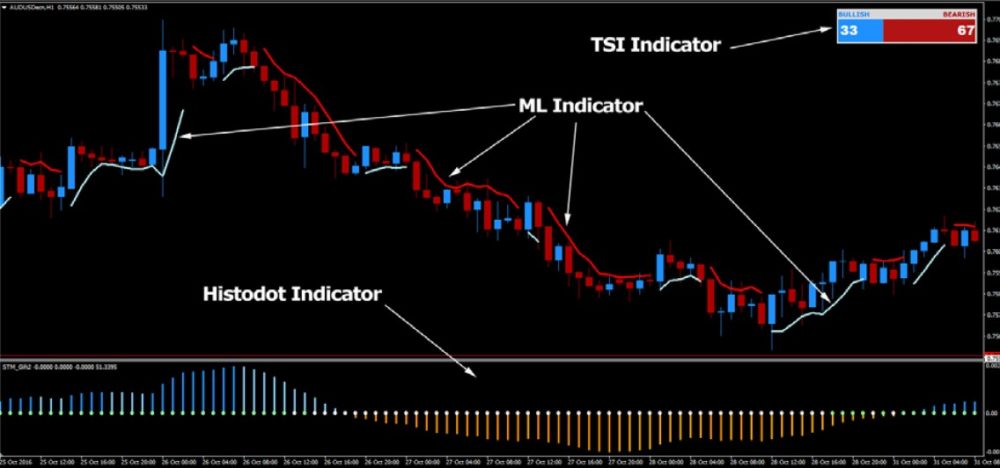
There are three proprietary, custom built indicators that are used in this system.
The first indicator is called the Trend Strength Indicator (TSI),
the second indicator is referred to as the ML Indicator and
the third indicator is known as the Histodot Indicator. Let’s take a closer look at each of these indicators.
FX Profit Wave indicators:
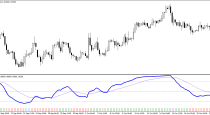
TREND STRENGTH INDICATOR (TSI)
As you can see on the image below, the TSI is fairly easy to read. It’s an indicator that shows the strength of the trend. If Bullish (blue) is over 50, it means the uptrend is stronger than downtrend. The higher the number, the stronger the trend. If Bearish (red) is over 50, it means the downtrend in stronger than uptrend.
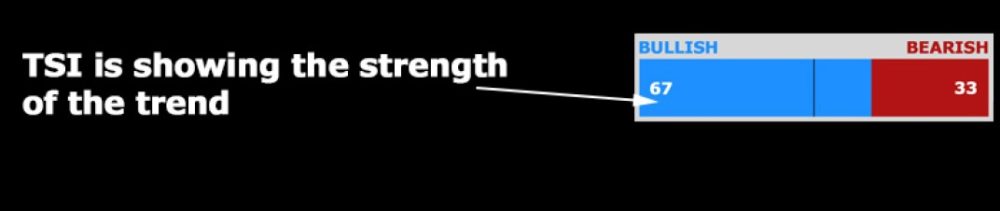
The TSI indicator will ultimately determine the direction in which we trade. If it’s showing the Bullish trend, we will be looking to enter the market with Buy trades. On the other hand, if it’s showing Bearish trend, we will be looking to enter the market with Sell trades.
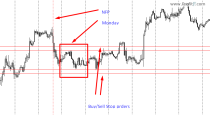
ML INDICATOR
The second indicator we will be using is the ML Indicator. This indicator is on the chart and will display a blue line below the candles for the uptrend and red line above the candles for the downtrend.
This indicator is a trend based indicator, which has the ability to determine and predict the trend movements with very high accuracy.
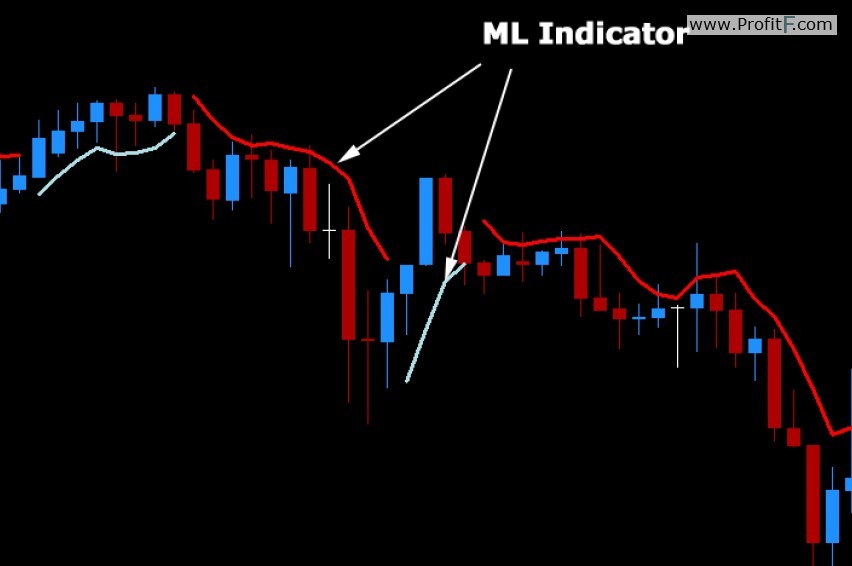
If the ML Indicator is showing the blue line below the candles, we will be only looking for buy trades, while if it’s showing the red line above the candle we will be looking only for sell trades
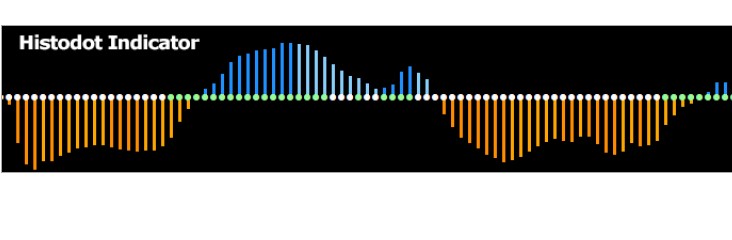
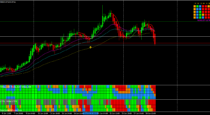
HISTODOT INDICATOR
The third indicator we will be using in the FX Profit Wave system is called the Histodot Indicator.
It’s made of two parts:
In order to get a valid buy or sell signal, both the Histogram and Dots have to be in alignment:
For buy trades:
Histogram must be blue and above the Zero Line (dots)
Dot must be green
For Sell trades:
Histogram must be orange and below the Zero Line (dots)
Dot must be white
On the following image you can see an example of the Histodot Indicator:
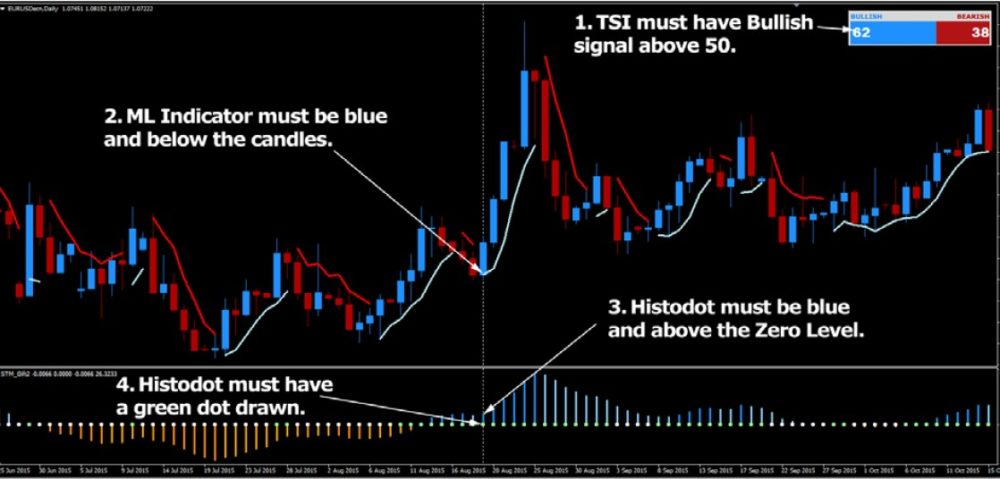
1. TSI must have Bullish signal above 50.
2. ML Indicator must be blue and below the candles.
3. Histodot must be blue and above the Zero Level.
4. Histodot must have a green dot drawn.
5. After all the conditions have been met, enter the trade at the close of the signal
candle.
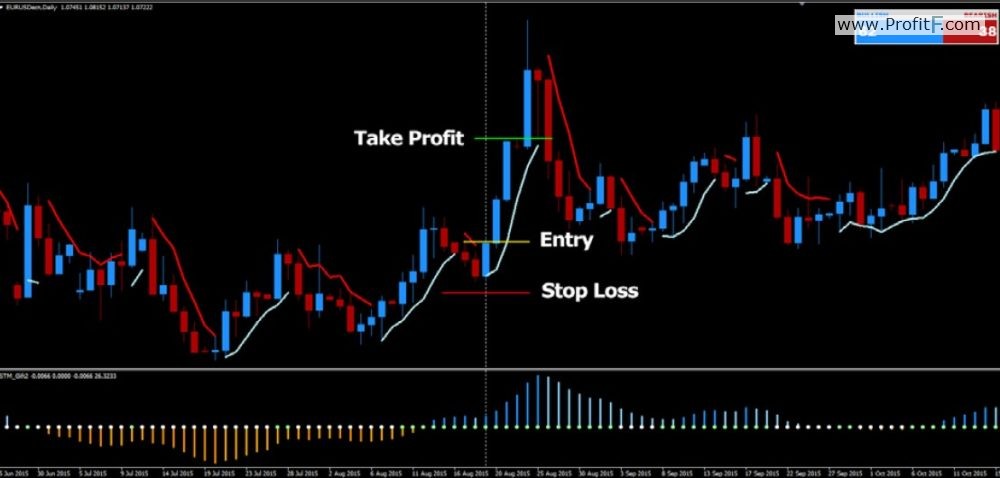
6. Set your Stop Loss a few pips below the most recent Swing Low.
7. Set your Take Profit twice the distance away from the entry level as your Stop
Loss or greater. I recommend a minimum of 1:2 Risk/Reward Ratio or greater.
On the following page you can see an example of a Buy trade as per the rules of the
system.
Buy Trade setup with all the conditions being met:
Buy Trade Entry, Stop Loss and Take Profit levels:
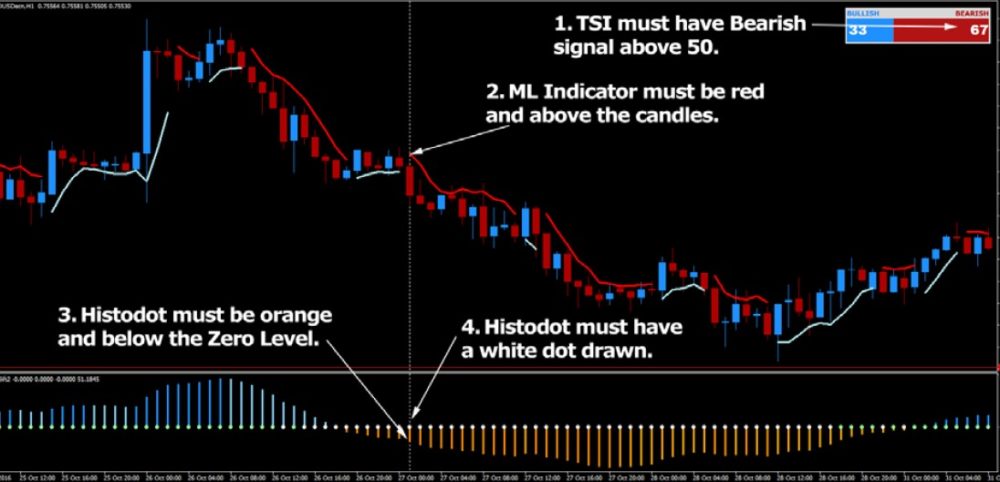
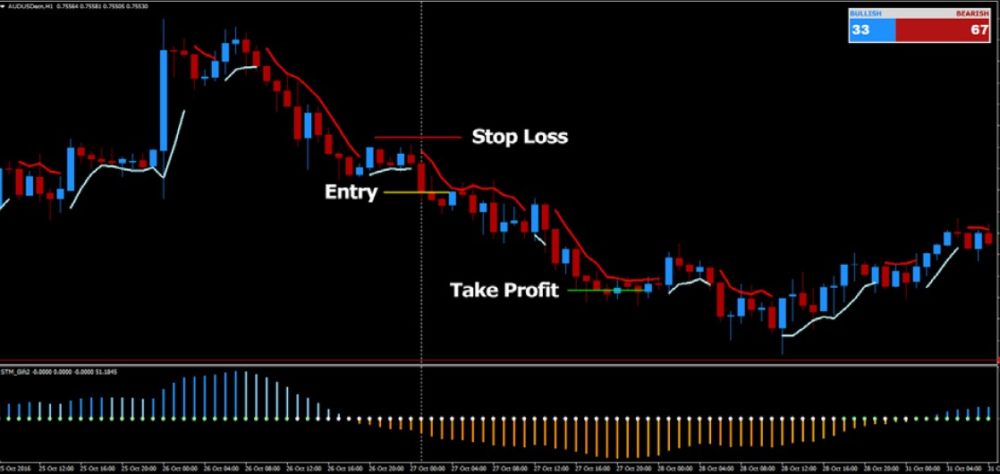
Let’s look at the rules for entering Sell trades:
1. TSI must have Bearish signal above 50.
2. ML must be red and above the candles.
3. Histodot must be orange and below the Zero Level.
4. Histodot must have a white dot drawn.
5. After all the conditions have been met, enter the trade at the close of the signal
candle.
6. Set your Stop Loss a few pips below the most recent Swing Low.
7. Set your Take Profit twice the distance away from the entry level as your Stop
Loss or greater. I recommend a minimum of 1:2 Risk/Reward Ratio or greater.
On the following page you can see an example of a Sell trade as per the rules of the
system.
Sell Trade setup with all the conditions being met:
Sell Trade Entry, Stop Loss and Take Profit levels:
This is part of “Scientific Trading Machine” system…. You can read our review of Scientific Trading Machine soon here >>

 (15 votes, average: 4.33 out of 5)
Does it work with Metatrader 5?

What time frame and currency pair is best for this strategy.