
TABLE OF CONTENTS:
As one of the most successful and well-known stock market traders, Thomas Bulkowski dealt with chart patterns throughout his career and became one of the world’s leading authorities on the subject.
After examining over 4.7 million chart candlestick patterns, He discovered some patterns that were a cut above the rest in accuracy. These best-performing patterns do not occur frequently on charts but when they do, they can be used to make significant trading decisions.
Let’s take a look at the top 5 performing chart patterns in both bull and bear markets.
These are the most reliable chart patterns according to trader and investor Thomas Bulkwoski:

The bearish three line strike, is a four candle continuation pattern that appears in a bearish trend. In this pattern, the first three candles are bearish followed by a bullish fourth candle. This fourth candlestick, closes above the highest close of the previous candlesticks.
Generally, it signals a small pullback that will be followed by a continuation of the existing bearish trend.
The bearish three line strike is one of those patterns that do not occur frequently and needs to meet specific criteria before it can be used. However, it provides a good entry point to participate in the existing trend and can be used for any currency pairs available in the forex market. Plus, it can be used along with other trend-following tools like the moving average crossover pattern.
When the pattern appears on a chart, it will show a sharp reversal of the existing trend and should only be used with additional confirmation. So, what filters can you use along with the bearish three line strike?
There are a number of filters you can use depending on the time frame and market you are trading with. These are some of the filters you can use:
Another indicator that can be used to show the level of volatility is the average true range indicator. This shows the average of the recent candle ranges and when compared with the ranges of the previous bars, it can show whether or not the market is volatile.
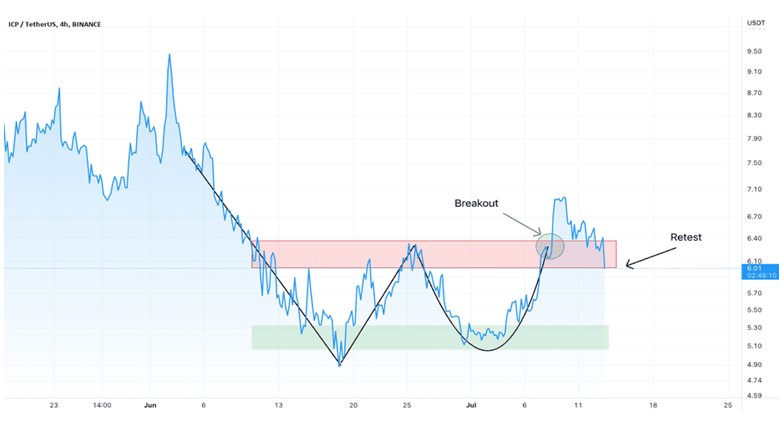
Also called the Adam and Eve double bottom or double top chart appears in charts after a long uptrend or downtrend. It was first mentioned by Thomas Bulkowski in his book Encyclopedia of Chart Patterns and is accurate in determining the change of a trend.
To identify the Adam and Eve pattern, it is marked by the first bottom or top which is the Adam. Then, the price moves either up or down and creates a U shape which is the Eve. There are two types of Adam and Eve:
When the Adam and Eve pattern forms, it signifies a shift in market sentiment and a strong price level might be broken. If the price fails to break through a support or resistance level, it will create new support or resistance levels where a continuation of the previous trend will occur.
Before trading the pattern, it must first be validated. For the Adam bottom formation, there must be a noticeable downward spike in prices as it attempts to make new lows. This spike must also occur if the Adam formation appears in an uptrend. If there are two consecutive spikes, the Adam will still be valid but the spike of the second half should be less than half of the first one.
As for the Eve formation, there should be an obvious price congestion in a wide range making the bottom of the Eve wider and rounder.
In addition, if the volume bar for the Adam is high, this means that the overall pattern is valid. However, it is advisable to wait for confirmation of a breakout above the patterns highest high before it can truly be considered as valid.
Once the pattern has been confirmed and a breakout is expected, it is preferable to enter the market at a retest of the confirmation line after the breakout and if the retest doesn’t occur, enter on the first retracement. Then set a stop loss 1 ATR below the confirmation line and employ other risk management tools available in forex trading.
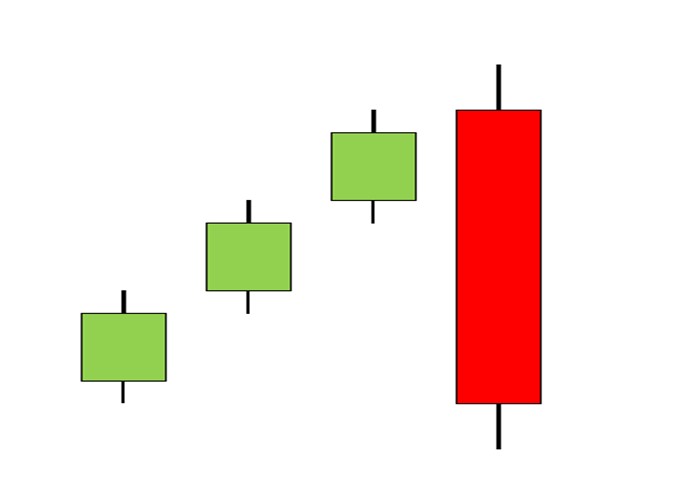
Similar to the bearish three line strike, the bullish three line strike consists of four candles. The first three candles are bullish and the fourth is bearish and closes below the other three.
It shows that the market is experiencing overbought conditions and people are starting to sell off their assets in anticipation of a pullback. This results in the fourth long bearish candle but the price will still head higher because of the prevailing trend.
Before using the pattern, you need to backtest if it works in your market and given time frame because it is not a universal pattern.
Once you have confirmed its application in your market, use market sentiment indicators to reduce the chances of bad trades. This can be done by comparing the strength of the asset you are trading to the strength of the overall market.
In addition, if the last candle in the pattern gaps up, this is usually a sign to take the pattern seriously because it signifies that the continuing trend will be stronger.
The three black crows predict a reversal in a downtrend. The pattern forms after the price falls for three consecutive days due to the actions of bearish traders. Therefore, it consists of three bearish candlesticks and is present in an uptrend.
This is a common pattern in Forex and when it appears, it is a signal to short sell the market. It indicates a weakness in the existing uptrend and the possible emergence of a downtrend. As such, it can easily be included in bullish trend reversal strategies.
Identifying the three black crows is relatively straightforward and simple. In an uptrend, all you need to do is look out for three long bearish candlesticks that appear in a row.
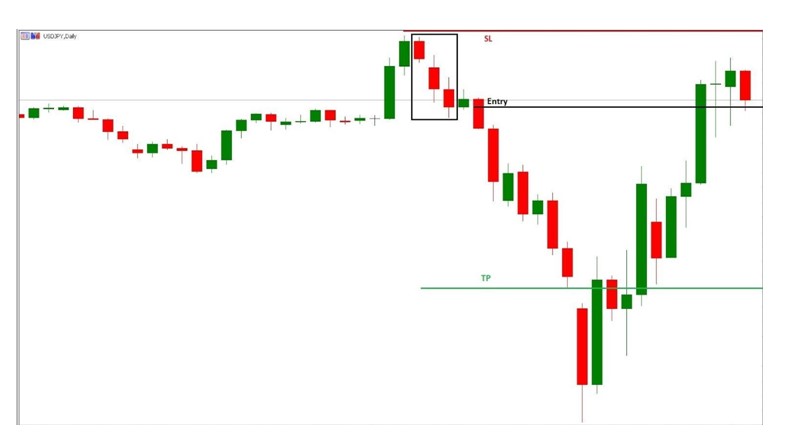
Before trading the chart pattern, pay attention to the length of the candlesticks. The first candle should be long-bodied and must be formed at the top of the uptrend.
The second candle should also be bearish but it can either be long or short. The closing price of this candlestick should be within the body of the first candle. The third candlestick can also be long or short as long as it is bearish. However, it should not break the high of the second candle.
To short the market using this pattern, enter a sell order beneath the third candle and set a stop loss above the high of the first candle.
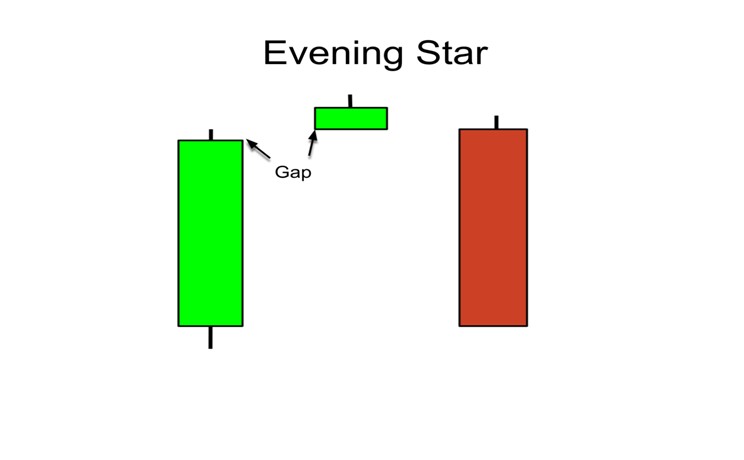
The evening star is not a common pattern but it is a reliable indicator of trend reversal and useful in technical analysis. This pattern typically consists of three candles. The first, is a long-bodied candle showing an increase in price with the closing price higher than the opening price.
The second candle can be described as a “star.” It can either be bullish or bearish with a small body. However, it may appear without a body as well. This star shows that the closing price was almost the same as the opening price which confirms that momentum is slowing.
In an ideal evening star pattern, there should be a gap up from the first candle to the star. Also there should be a gap down from the star to the third candlestick.
This third candle is bearish and indicates a start of the new downtrend. However to identify the pattern and confirm the start of a new downtrend, it is important to use trend lines and price oscillators for confirmation.
Plus, traders do not have to rely on just the evening star as a bearish indicator. Indicators like the bearish harami, the shooting star, and bearish engulfing candlesticks are also popular patterns that can give you the same accurate results as the evening star.
Trading with the Evening Star
Once the evening star pattern is completed and confirmed, traders can enter the market at the open of the next candle to appear. If you don’t want to take the risk, it is advisable to wait until the price trends a little lower. However for highly volatile markets, you could end up with a bad entry.
A stop loss can be placed above the most recent swing high because the reversal would be invalid if the level is broken.
Chart patterns are not only visually appealing, but they are easy to decipher and let you know what is happening in the market. The problem lies in deciding which ones to use because there happen to be so many of them.
For now, focus on improving your knowledge on these five and see if you can incorporate them into your strategies. And as your experience grows, you can utilize other patterns or even more advanced ones to increase your chances of success.
 (No Ratings Yet)


Add your review