The Price and Volume Trend Indicator or PVT for short is another oscillator that is used to measure the price to volume relationship. The PVT indicator functions similar to the On Balance Volume indicator and depicts the growing sum of the trade volume in relation to the changing prices. Unlike the OBV indicator, the PVT indicator adds and subtracts only a portion of the volume depending on rising and falling volume and the changes in price.
The PVT indicator is often considered to be a bit better than the OBV indicator as it tends to represent the price dynamics more closely.
The PVT indicator comes with just one setting, where traders can choose what price point to apply the indicator to. The most common price for calculating the PVT is to the closing prices, but they can be changed to apply the PVT indicator to High/Low or Opening prices as well.
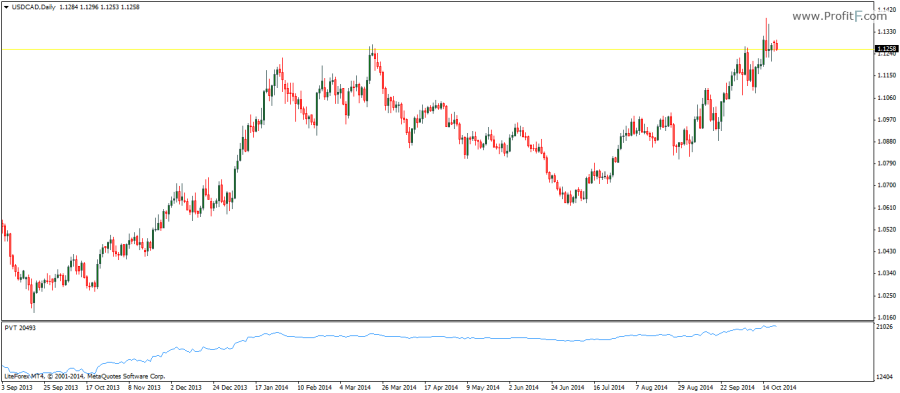
The PVT indicator works in both ranging and trending markets with divergence based trading being the more popular approach. The traditional methods of overbought or oversold levels are not particularly reliable as there are no fixed values for the PVT oscillator. During ranging markets, the PVT oscillator can continue to rise without any signs of declines and the same is reflected during declining PVT indicator as well, making divergence of the PVT to price the more reliable method of trading during trending markets.
Download The Price and Volume Trend Indicator
 (No Ratings Yet)