
1-EURUSD trading plan.
Wait for pull back to 1,135 or 1,130 to look for buying signals. Consider selling reversal around 1,145 (counter trend), or buy that level on a confirmed break out. Try to keep long position a little bit longer for that pair may really rise.
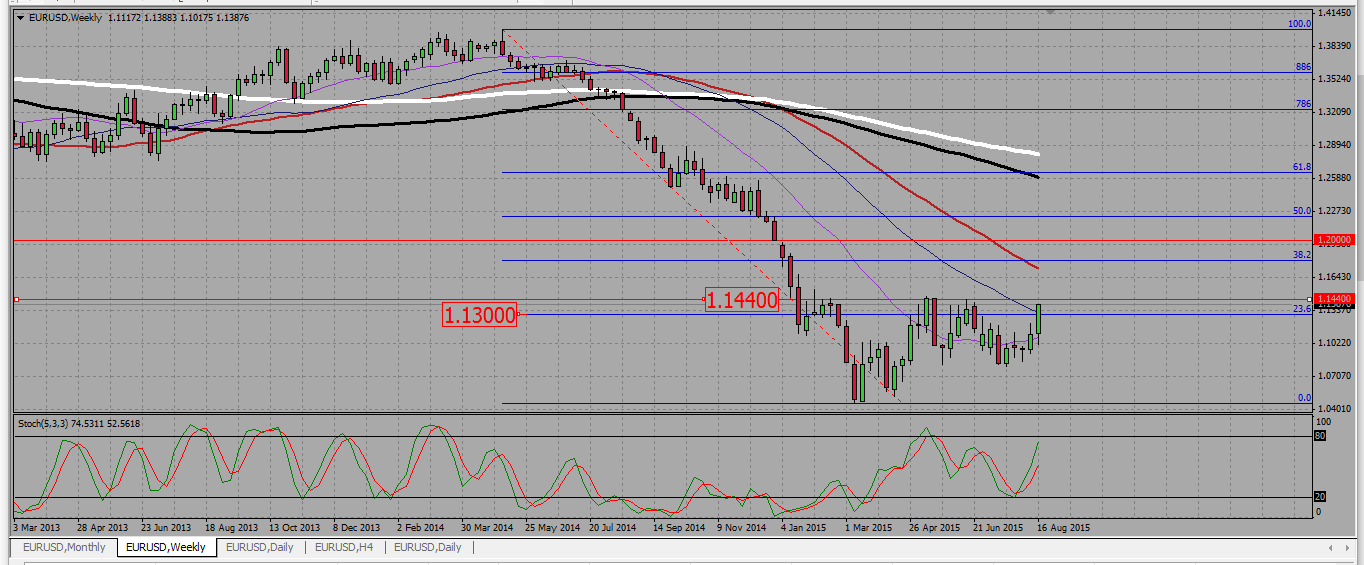
On the weekly chart we see a solid bullish candle, that broke up a fib line resistance at 1,13, where the 40 SMA may be found. An horizontal resistance line is located at 1,440.
EURUSD WEEKLY CHART.
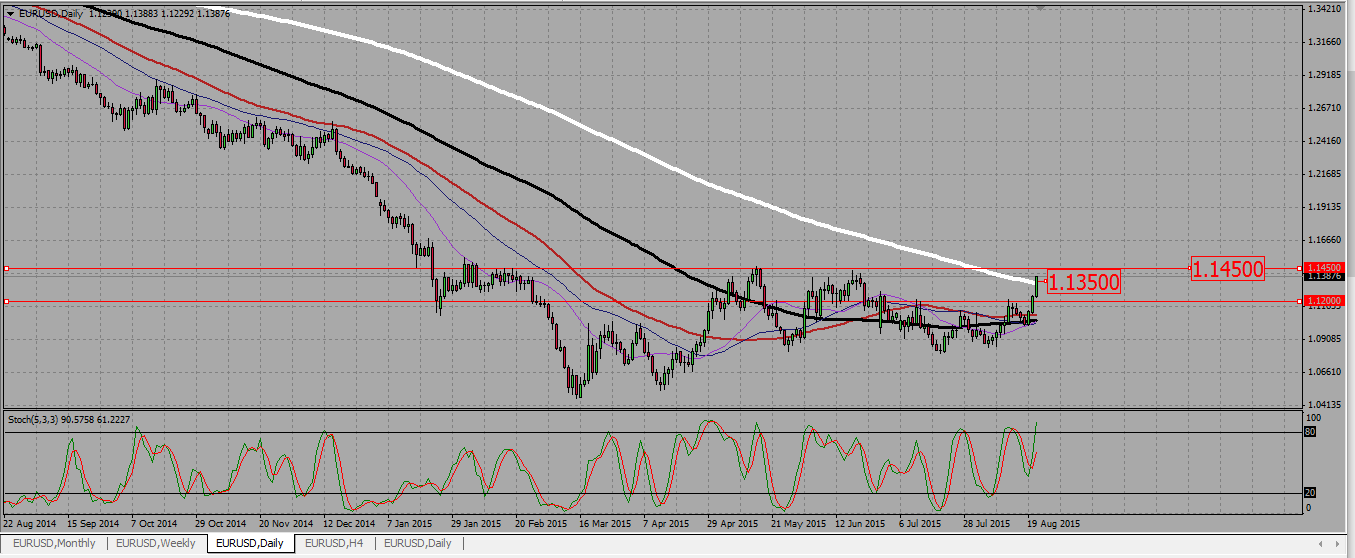
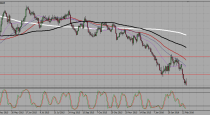
On the daily chart we can see the pair broke the 200 SMA located around 1,135. This is a support and I will be looking for long signals near that area. There is another support near 1,12, but is is now quite far away and it is unlikely we will consolidate that far.
EURUSD DAILY CHART.
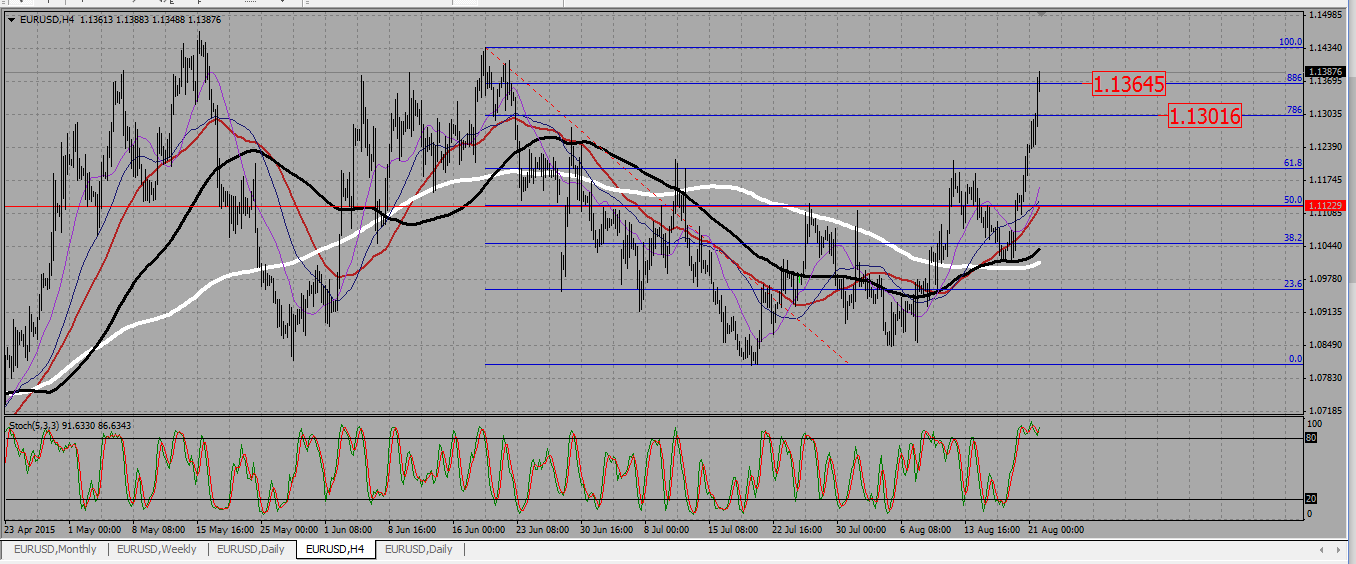
Finally, by inputing a fib retracement on the H4 chart, we see the pair broke a 0,886 line resistance around 1,1365 (near the daily 200 SMA). The 0,786 retracement is located around 1,13 (also a 23,6 weekly fib line support) and is the second support zone where I will look for buying signals should we get there.
EURUSD H4 CHART.
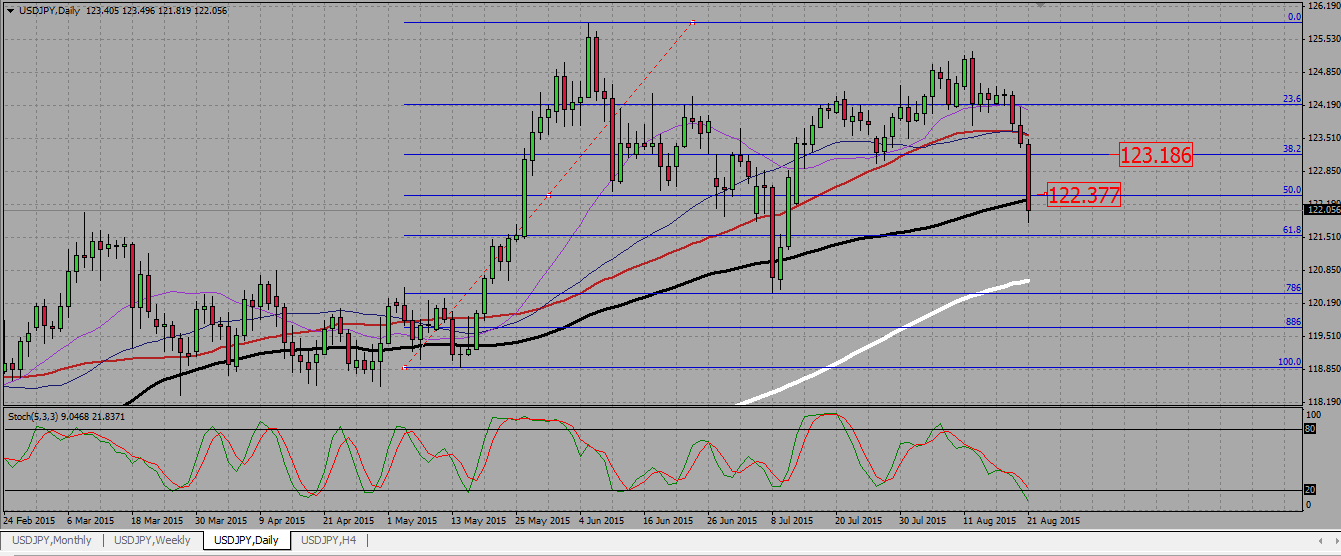
2-USDJPY trading plan.
That pair looks bearish but is now located on a support around 122. Wait for a pull back towards 122,3 or 123 to look for shorts, or sell a confirmed break out of 122/121,5.
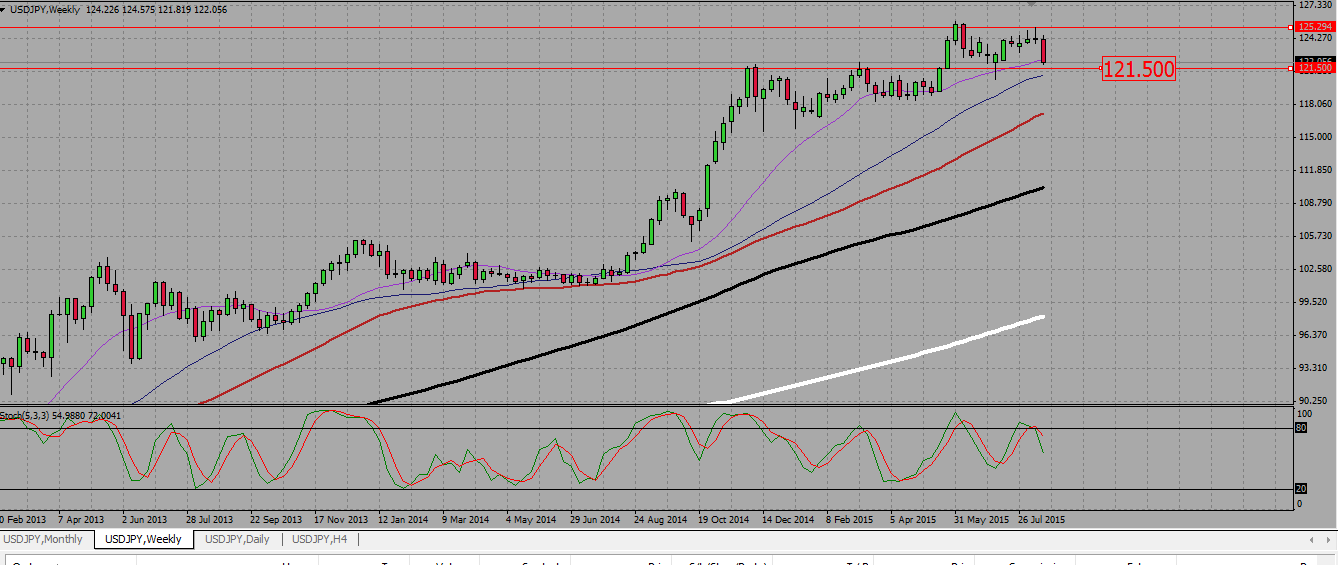
On the weekly chart, we see a huge bearish candle after a double top. The pair will most probably keep on going south, as this candle is very powerful, but we see it stands above a support around 122/121,5, where there is the 20 SMA and a horizontal line. Therefore a bullish consolidation to begin the week cannot be ruled out.
USDJPY WEEKLY CHART.
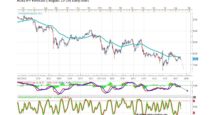
The daily chart shows us a three black crows pattern, with a strong third candle. Please pay attention to the down wick on that last candle; the week ended with a minor bullish consolidation. That chart shows us two resistance levels where we may look for selling signals : the 122,25 with the 100 SMA and a 50 fib level, and around 123 where is located a 38,2 fib resistance line.
USDJPY DAILY CHART.
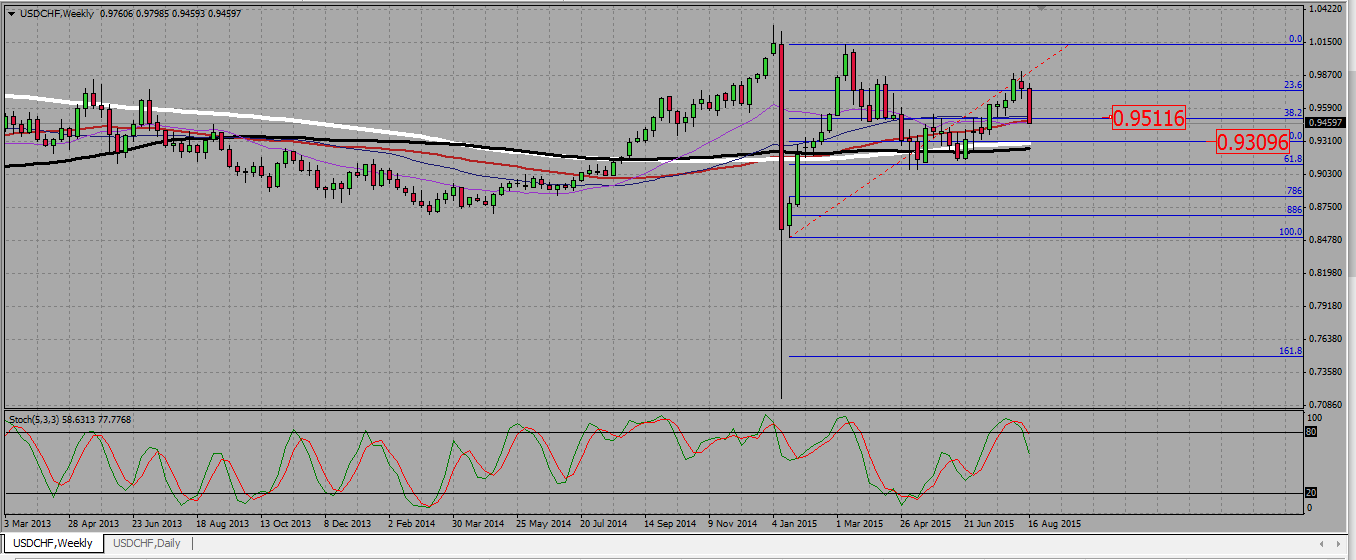
3-USDCHF trading plan.
Look for selling signals around 0,95/0,955 to aim for 0,93.
On the weekly chart we see a very powerful bearish candle starting from a 23,6 fib line around 0,975 to end slightly under the 38,2 fib line located at 95. Both SMAs 40 and 55 are also located here, making it a strong resistance/support line. We may also spot a support, and therefore a potential take profit line around 0,95, with both the 100 and 200 SMAs, altogether with a 50 fib line.
USDCHF WEEKLY CHART.
The daily chart shows us a three black crows pattern, but also underlines the role of the 200 SMA, currently located around 0,955. This is the place I do not want to see broken up in order to keep a bearish bias.
USDCHF DAILY CHART.

 (No Ratings Yet)
Add your review