We are just three weeks away from the Brexit referendum (see time of this event in our Economic calendar), so be careful when trading the cable. Watch price action around 1,465 – 1,47, and buy break out towards 1,495. Watch also price action around 1,44, and sell break out towards 1,405. Between 1,44 and 1,465 favor selling signals, as long term SMAs indicate a downtrend.
On the monthly chart, last month candle is a indecision bearish high waved candle, resting just above a 0,786 Fibonacci level around 1,44. SMAs are rather suggesting a down trend. The pair previously made a new low around 1,38, and bumped from it, but not very strongly. That chart does not offer a lot of clue concerning cable’s possible next move.
GBPUSD MONTHLY CHART.

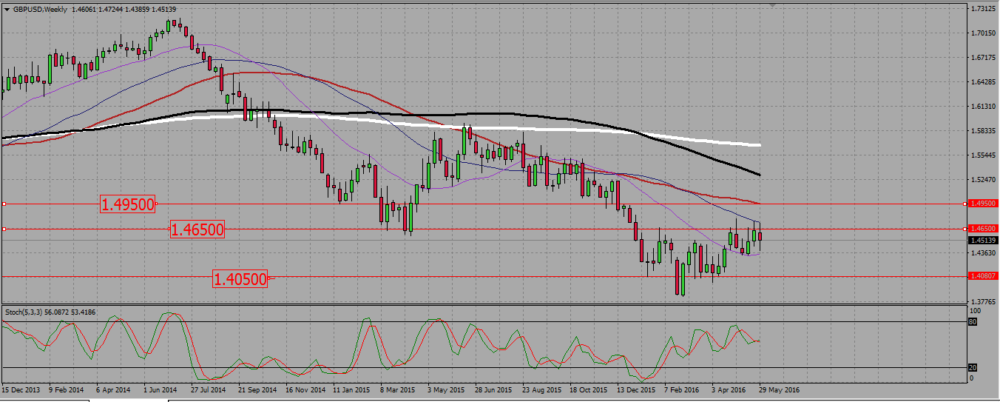
On the weekly chart, SMAs are showing a downtrend, with the pair being under a bullish consolidation. GBPUSD is now reaching a resistance near 1,465, and we should look for selling signal at that level to go back to 1,44 (the monthly Fibonacci support level), and then 1,405 (triple weekly bottom). If the pair breaks up the resistance around 1,465 (let us say 1,47), the next resistance is around 1,495.
GBPUSD WEEKLY CHART.

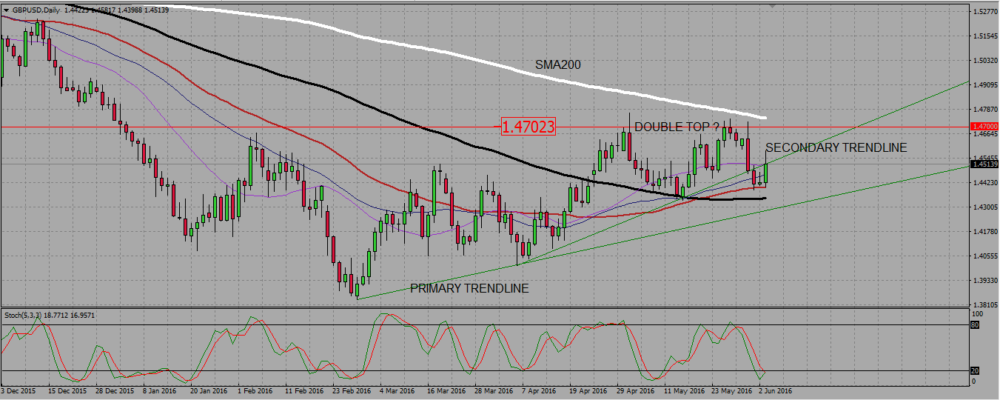
On the daily chart, we see the bullish consolidation being under attack. The pair did not manage to make a higher low and seems to have double bottomed around 1,47. The SMA200, pointing down, also lurks just above 1,47, adding to the strength of that resistance. After rejecting that 1,47 level for the second time, the cable went sharply down, even broking a secondary trendline support, that the pair retested Friday post NFP. You may wish to compare the cable’s Friday candle with the candle we saw on the eurodollar. This shows how weak is the GBPUSD. This is why I prefer to look for selling signals on that pair.
GBPUSD DAILY CHART.

Add your review