

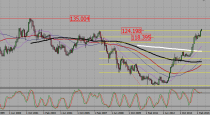
The USDCAD is trading inside of its resistance area which is visible in light grey in the above H4 chart from were forex traders may decide to realize floating trading profits after a healthy rally. This is expected to lead to a profit taking sell-off which will take this currency pair back down into its support area marked in light blue. The Bollinger Band indicator shows the potential end of the current rally in the USDCAD.
The upper band of the Bollinger Band indicator is trading inside of its resistance area while the middle band as well as the lower band are trading below it. Price action is trading between the middle band and the upper band; a breakdown below the middle band is expected to further fuel the profit taking sell-off. The middle band is sloping higher while the lower band is sloping lower. This divergence is likely to narrow over the next few trading sessions.
Forex traders are advised to enter short positions at 1.3290 and above in order to profit from the expected profit taking sell-off in this currency pair. Conservative forex traders should wait for price action to break down below the middle band of its Bollinger Band Indicator which will increase selling pressure. A take profit target of 1.2950 has been selected for a potential trading profit of 340 pips. More sell-order are expected below the middle band of the Bollinger Band indicator.
Forex traders should protect this trade with a stop loss level at 1.3400 for a potential trading loss of 110 pips which will result in a Risk-Reward (RR) ratio of 3.09.
USDCAD
Short @ 1.3290
TP @ 1.2950
SL @ 1.3400
RR: 3.09
 (No Ratings Yet)
Add your review