Subscribe to Updates (Weekly forex analysis by Stephen L) via Email
USDJPY trading plan.
The pair is retesting a strong support zone above 99. Watch price action at that level for a bullish reversal or a confirmed bearish break out.
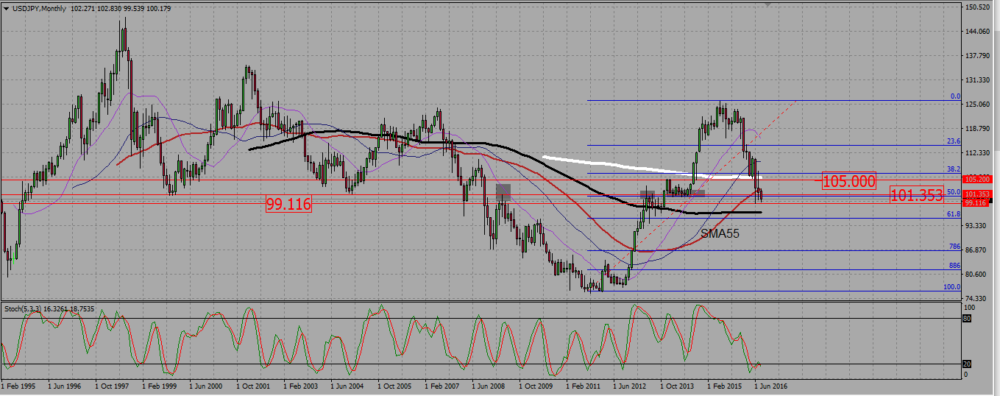
On the monthly chart, and after a bearish move between February and May this year, the pair lost steam and cannot pass a support/resistance zone around 100. The lower band of that zone is near 99, and this is the level you need to follow for a bullish reversal or a bearish break down.
USDJPY MONTHLY CHART.
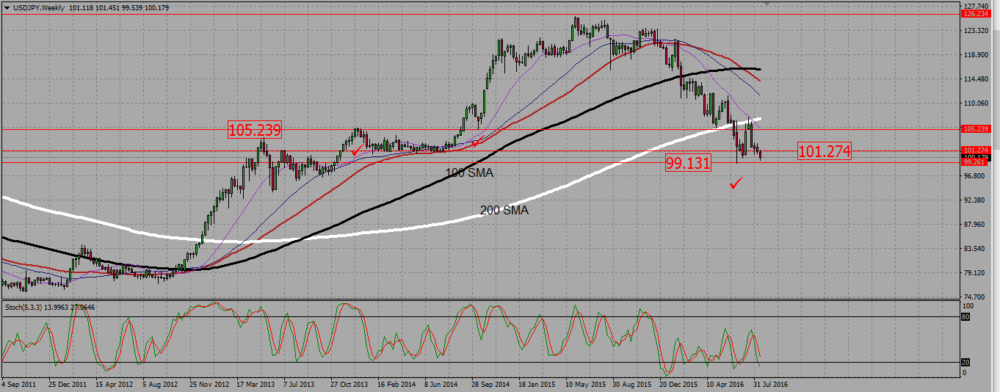
On the weekly chart, please note long terms SMAs are pointing up, indicating an uptrend. The pair is retesting the 99 support, but as we are in an uptrend, we should buy reversal signals there, and sell only confirmed break down.
USDJPY WEEKLY CHART.
Finally the daily chart is a clear downtrend, but the last candle is a piercing pattern. This shows the bears are having problems sending that pair lower. If you buy a reversal around 99, watch out the Fibonacci ressitance around 101,8. That may even be a good take profit level.
USDJPY DAILY CHART.

 (1 votes, average: 5.00 out of 5)