
The Japanese have contributed a lot to the Western world in trading. From Candlestick, Heiken Ashi charts, Renko and Kagi charts to the Ichimoku trading system. Considered to be one of the best trading indicators, the Ichimoku trading indicator is in fact a trading system of its. Roughly translated to English, Ichimoku Kinko Hyo, or Ichimoku for short, stands for Equilibrium of Price. The Ichimoku Indicator is one of the standard indicators that are available in many charting platforms. In this article, you will learn the various components of the Ichimoku indicator and how to trade the buy/sell signals it generates.
Components of the Ichimoku Indicator
The ichimoku trading indicator is made up of the following components
The default indicator settings for the Ichimoku is 9, 26 and 52. The reason for using these values is based upon an ancient Japanese work week. The 9 periods indicate one and half weeks or 9 trading days, while 26 indicates a full trading month and 52 indicates two trading months. Bear in mind that when the Ichimoku indicator was developed, the average Japanese work week was 6 days.
The chart below shows the Ichimoku Indicator and its various components.

The Ichimoku indicator is formed with the following parameters.
Chikou (Lagging Span): This line merely reflects current price but shifted to 26 periods ago
Tenken/Kijun Sen (Conversion/Base line): The Tenken sen is the moving average of the highest high and the lowest low of the previous 9 periods, while the Kijun sen is the moving average of the highest high and the lowest low of the previous 26 periods.
The Tenken Sen can therefore be remembered as the short term moving average, while the Kijun Sen can be remembered as the long term moving average.
Span A/Span B: The Senkou Span A is plotted as the average of the Tenken and Kijun Sen, while the Senkou Span B is plotted as the average of the highest high and lowest low of the past 52 days. Both the Span A and Span B lines are projected 26 days into the future. The difference between the Span A and Span B is usually filled and forms the Kumo cloud. The Span A Span B lines can also be viewed as dynamic support and resistance levels.
Interpreting the Ichimoku Trading Signals
Each component of the Ichimoku indicator forms a trade signal in itself. The following section describes the Ichimoku components’ trade signals.
Chikou Span: When the Chikou Span is above price, the sentiment is bullish and when it is below price, the sentiment is bearish. The chart below illustrates this point.

To put it in another way, if current price is above previous price 26 periods ago, it is a bullish sentiment and if current price is below price 26 periods ago, it is bearish sentiment. When Chikou span is close to price, or ranging the market is considered to be in consolidation, or no trend.
Tenken/Kijun Cross: The Tenken sen and Kijun sen crosses are similar to a moving average cross. Refer to the chart below for the illustration. In this chart we notice how the bullish/bearish sentiments are displayed with the crossovers of the short term Tenken Sen over the longer term Kijun sen.

Price in relation to Kumo: Finally, when price is below the cloud, it reflects the bearish sentiment and when price is above the cloud, it reflects bullish sentiment. When price is trading in the cloud, it exhibits consolidation phase.

As we can see from the above explanation of the individual components of the Ichimoku indicator, they exhibit the market sentiment and therefore signal buy/sell opportunities accordingly.
Ichimoku Trading System – Putting it together
Now that we have an understanding of the various components of the Ichimoku trading indicator, it is now time to combine these individual elements to form the Ichimoku trading system. The checklist below should offer an easy reference for the trader using the Ichimoku trading system.
Ichimoku Buy
When all the above conditions are met, a buy signal is indicated by the Ichimoku Indicator.

Ichimoku Sell
When all the above conditions are met, a sell signal is indicated by the Ichimoku Indicator. Stops can be placed at just above the Cloud at Span A or below the Cloud at Span B. Some prefer to use the Kijun sen for trailing the stops, but at the cost of getting stopped out prematurely within the trend. It is therefore up to the trader to decide where they want to trail the stops.

Note that there is particular order for the signal to be triggered, as long as all the conditions are met.
The above two examples show Ichimoku trading indicator can be used to pick highly profitable trades. It is worth mentioning that there are no predetermined take profit levels. Therefore, Ichimoku trading system makes it ideal for capturing a most part of the trend. It can be used on any time frame and in any markets.
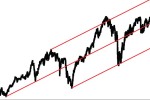
The Ichimoku indicator is best used in trending markets. The chart below shows sideways price action and as obvious, the Ichimoku indicator can be confusing. It is therefore best to not trade during sideways market.

Ichimoku Trading System – In Summary
To summarize, the Ichimoku trading system is one of the best and simplest of trading systems that works best in trending markets and works in any time frame. With due practice and patience, Ichimoku can trigger some very profitable trades when a trend is established.

 (12 votes, average: 4.42 out of 5)
There is no more complete indicator in technical analysis, It tells you virtually everthing you need to know about the price, It’s a great trend trading system.


Agreed. i have used it a few times but now i am convinced it is my best indicator/strategy/signal/filter/trading style. Any one used different parameters frm the default 9.26.52?Advise